Found in this great toot
Found in this great toot
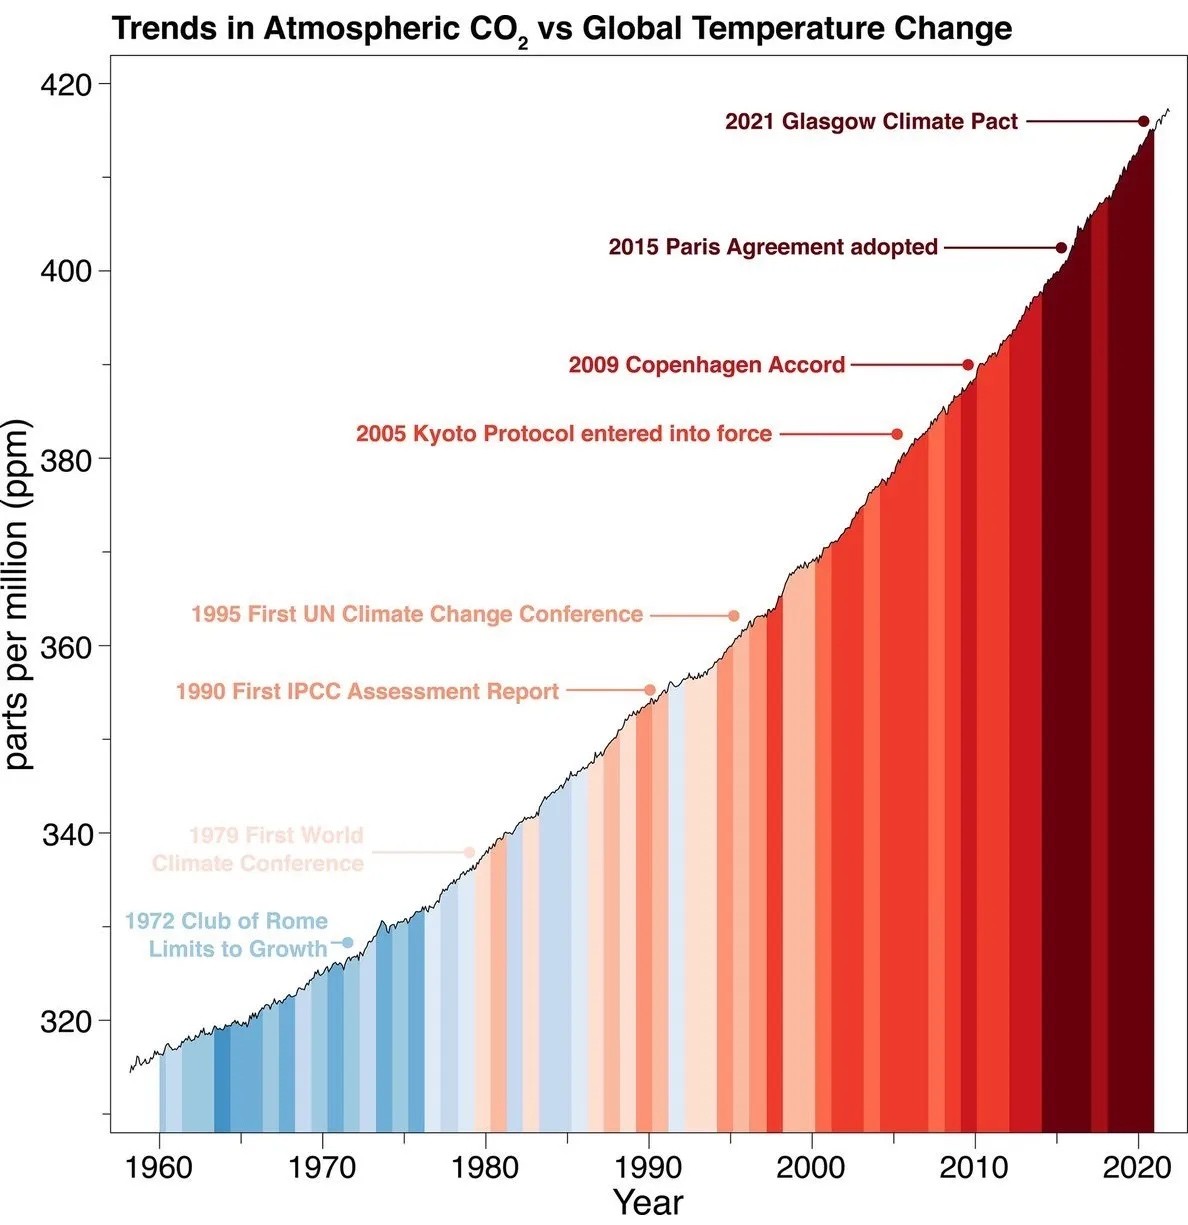
by focusing on a smaller numerical range, the slope of a linear graph will become steeper. if the graph went from 0 to 420, the entire range of this graph would have to be compressed into about 1/4 the space, so its y range proportional to x will be only 1/4, and since that is what determines the slope, that will be substantially flatter.
I'm not attempting to dismiss or minimise what is shown on the graph, I just think that it needs the added context of what earlier CO2 levels were.