Found in this great toot
Found in this great toot
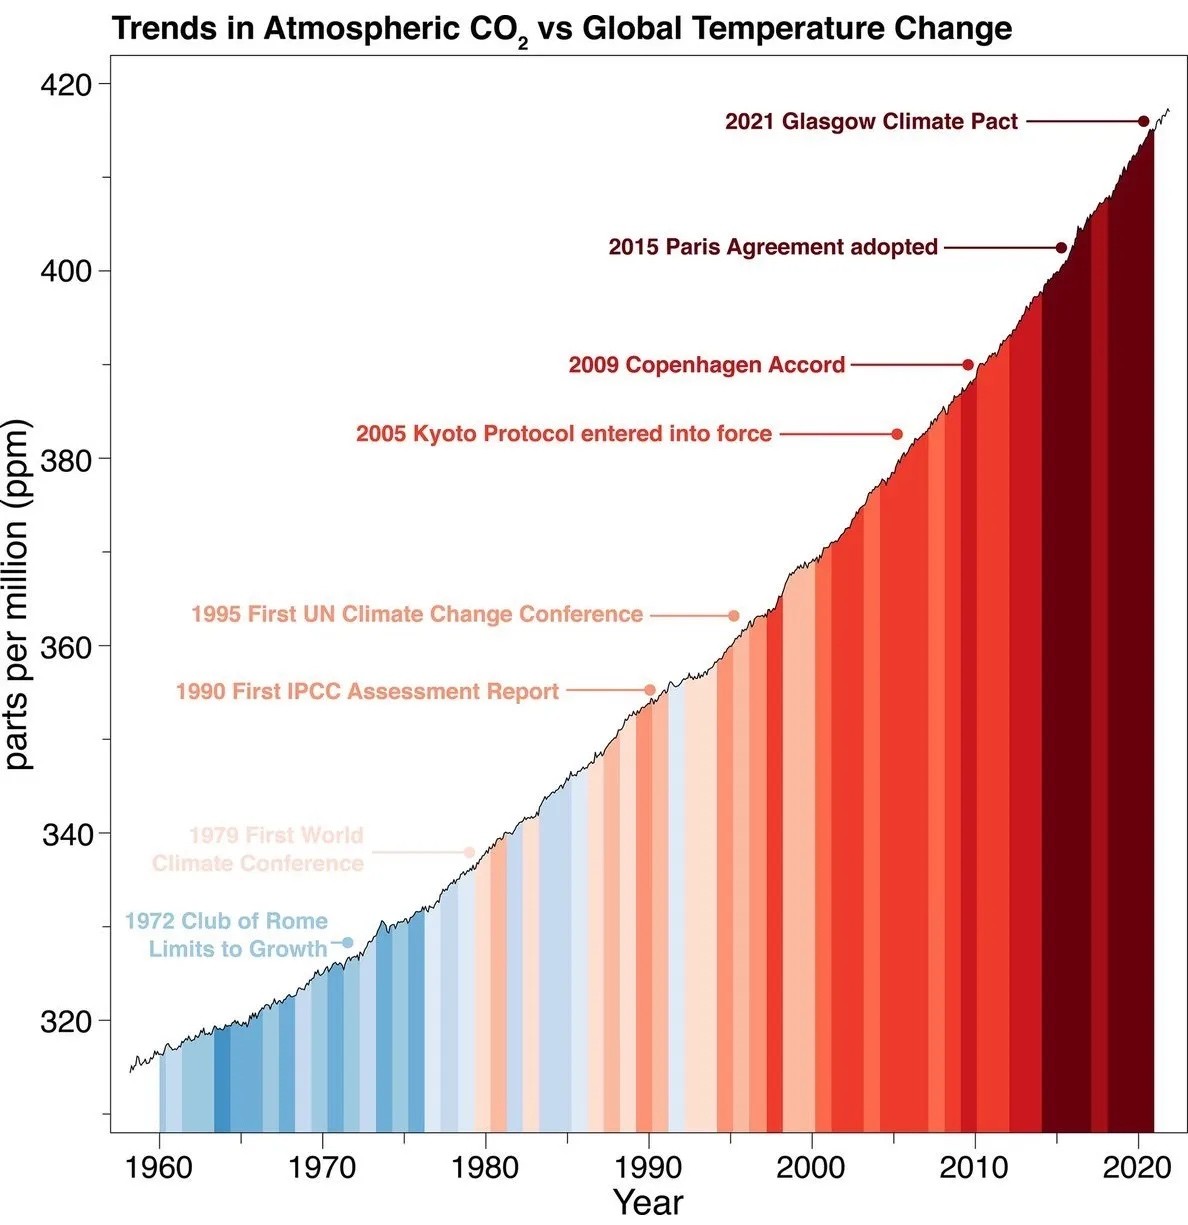
It's not just the numerical range, it's also the time scale. What I'm getting from the graph is that they wanted to convey instances of humanity saying "this is a problem and we should do something." Meanwhile the problem just compounded. Expanding the time and count scales would show the start of the rapid upswing that came with the Industrial Revolution, for instance. This is useful for context (and has been done many times over), but leaves no room to pick out the events noted.