1
 
 
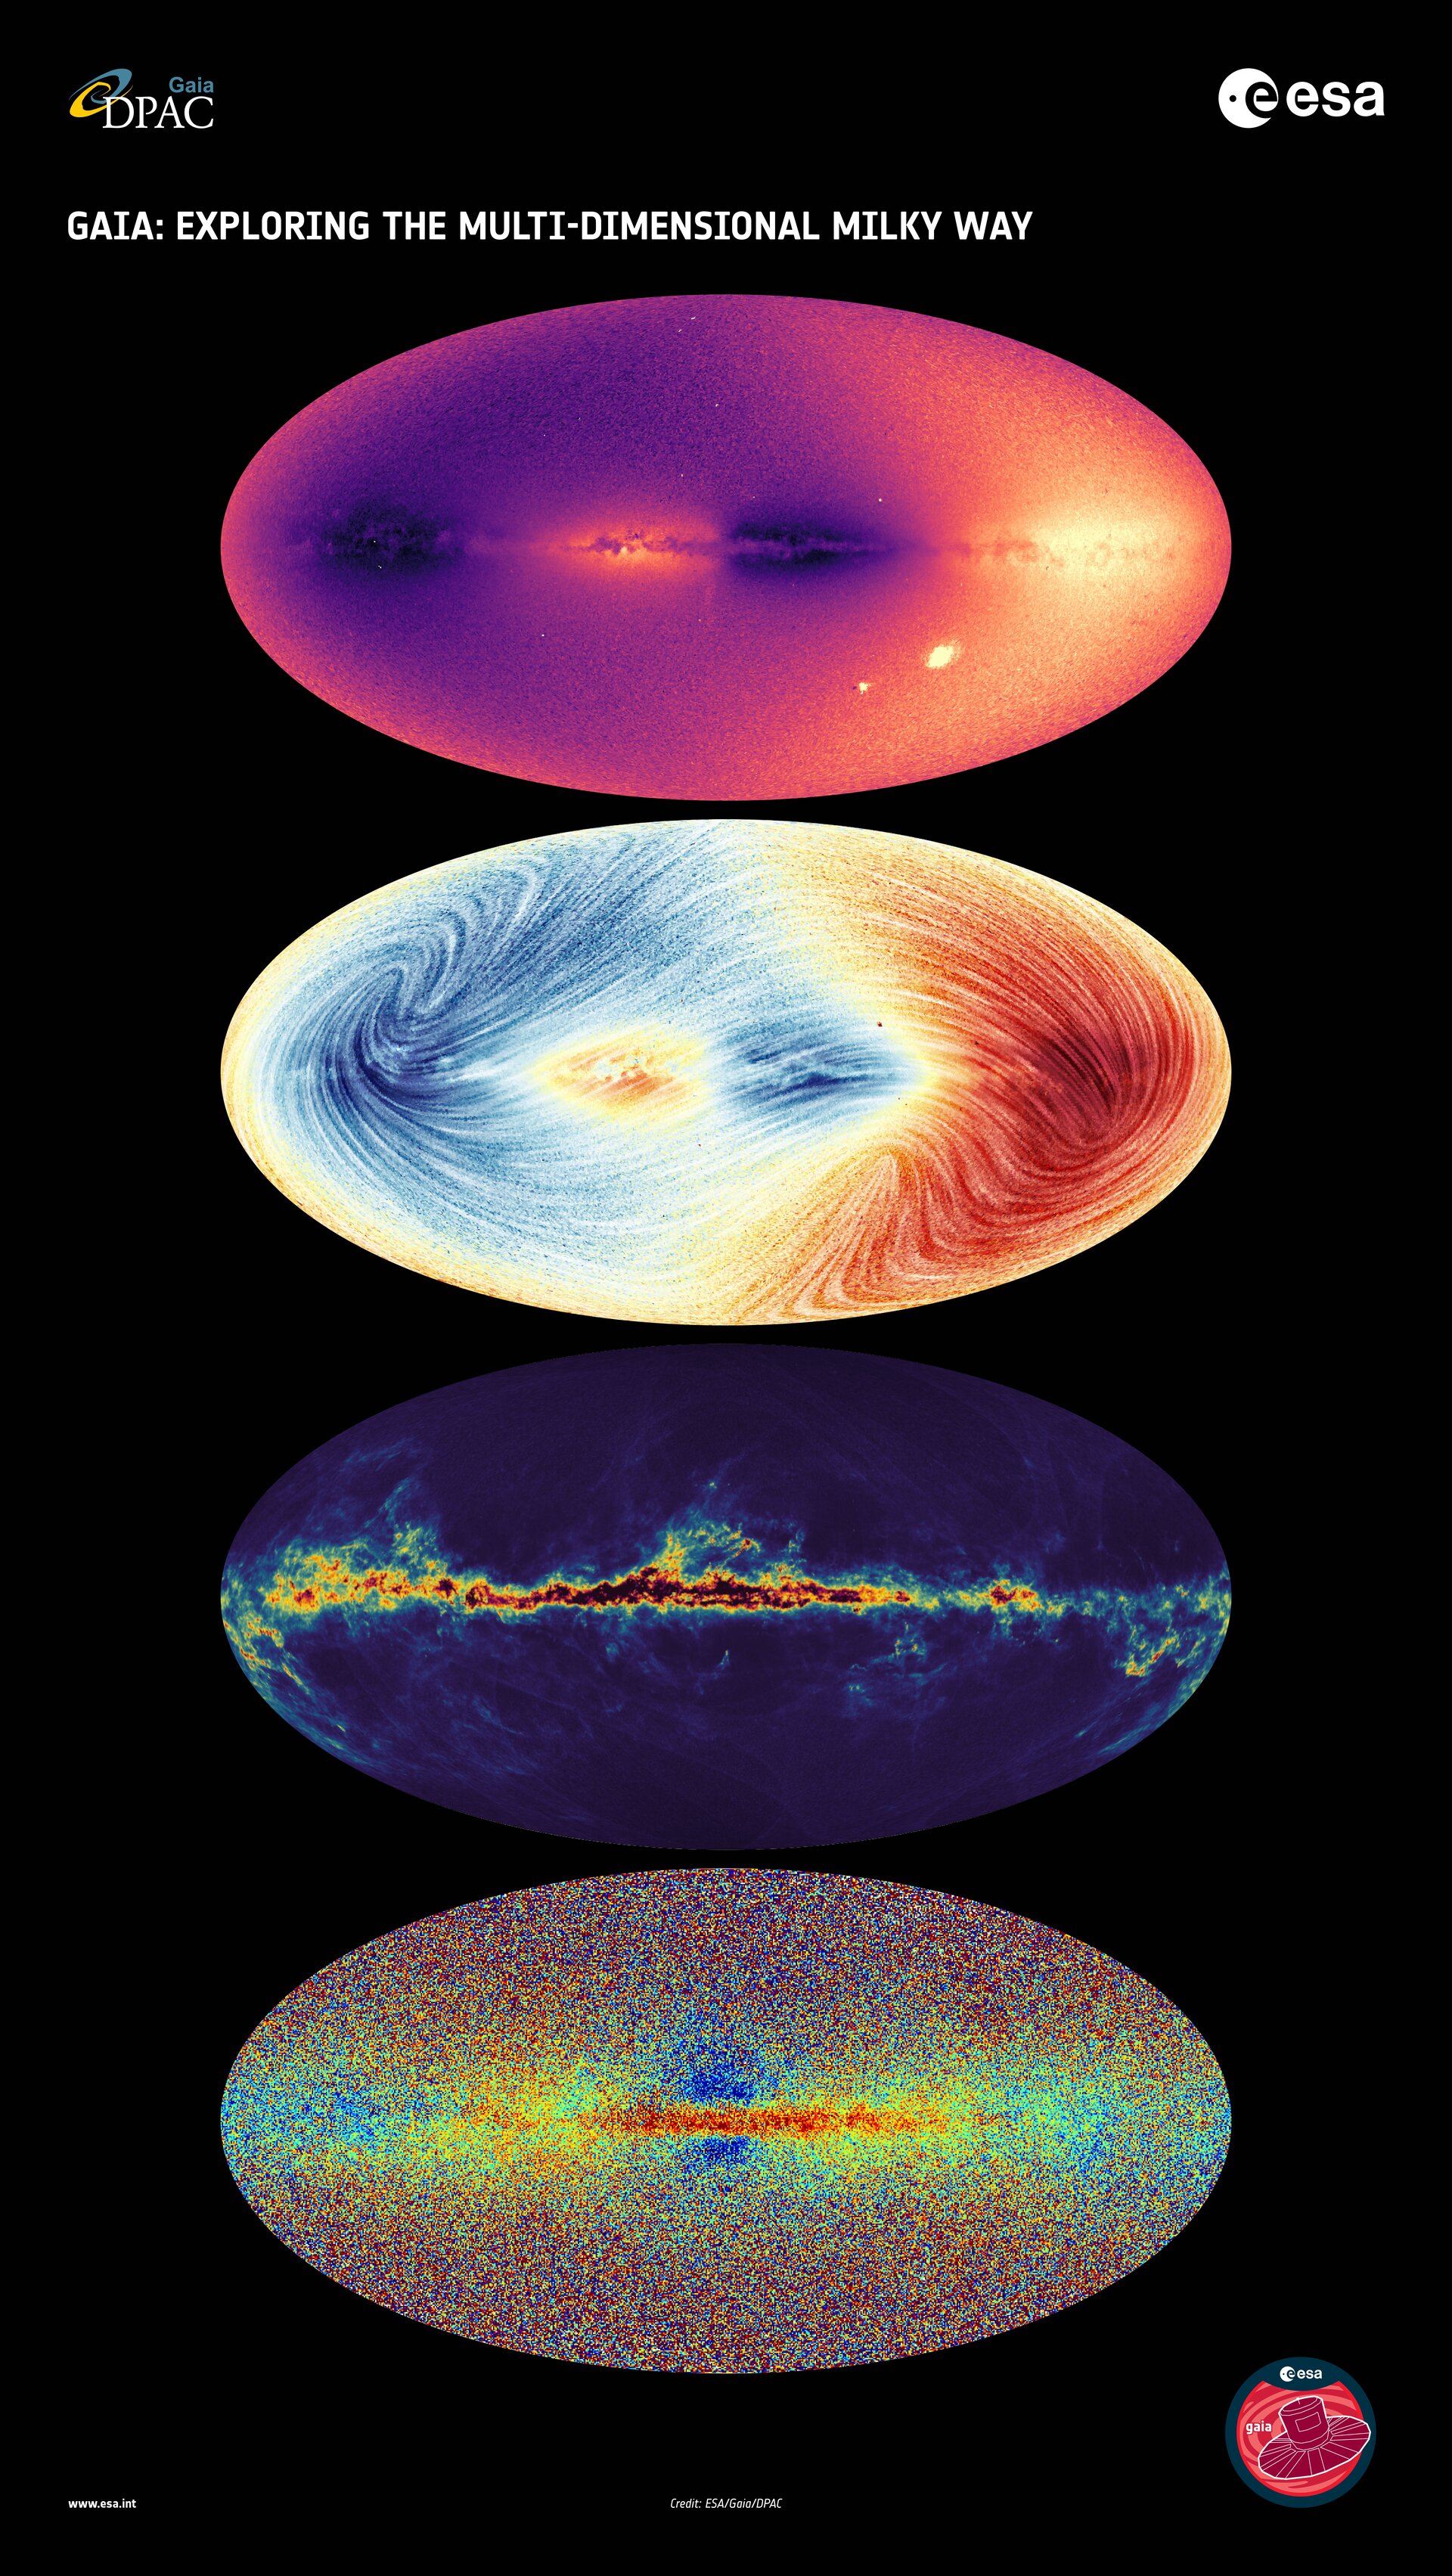
  1. Radial velocity

ESA’s Gaia data release 3 shows us the speed at which more than 30 million objects in the Milky Way (mostly stars) move towards or away from us. This is called ‘radial velocity’. We can now see how the objects move over a large portion of the Milky Way’s disc.

The rotation of the disc, projected along the line-of-sight, is visible from the alternation of bright areas (moving away from us) and dark areas (moving toward us). Several objects whose radial velocity differs from that of their close environment are visible by contrast.

The Large and Small Magellanic Clouds (LMC and SMC) appear as bright spots in the lower right corner of the image. The Sagittarius dwarf galaxy is visible as a faint quasi-vertical stripe below the Galactic Centre. Several globular clusters appear as tiny dots in the image, such as 47 Tucanae, the dark dot on the immediate left of the SMC.

  1. Radial velocity and proper motion

This sky map shows the velocity field of the Milky Way for ~26 million stars. The colours show the radial velocities of stars along the line-of-sight. Blue shows the parts of the sky where the average motion of stars is towards us and red shows the regions where the average motion is away from us. The lines visible in the figure trace out the motion of stars projected on the sky (proper motion). These lines show how the direction of the speed of stars varies by galactic latitude and longitude. The Large and Small Magellanic Clouds (LMC and SMC) are not visible as only stars with well defined distances were selected to make this image.

  1. Interstellar dust

Gaia not only maps the stars in our galaxy but tells us what is in between the stars. The space between stars is not empty but instead filled with dust and gas clouds, out of which stars are born.

Through the precise measurements of the stars' positions and their dispersed light, Gaia allows us to map the absorption of the starlight by the interstellar medium. Those maps provide us with essential clues to the physical mechanisms of the formation of stars, galaxies, and the history of our home galaxy.

This map shows the interstellar dust that fills the Milky Way. The dark regions in the centre of the Galactic plane in black are the regions with a lot of interstellar dust fading to the yellow as the amount of dust decreases.The dark blue regions above and below the Galactic plane are regions where there is little dust.

  1. Chemical map

What stars are made of can tell us about their birthplace and their journey afterwards, and therefore about the history of the Milky Way. With today’s data release, Gaia is bringing us a chemical map of the galaxy.

With Gaia, we see that some stars in our galaxy are made of primordial material, while others like our Sun are made of matter enriched by previous generations of stars. Stars that are closer to the centre and plane of our galaxy are richer in metals than stars at larger distances.

This all-sky view shows a sample of the Milky Way stars in Gaia’s data release 3. The colour indicates the stellar metallicity. Redder stars are richer in metals.

CREDIT

ESA/Gaia/DPAC; CC BY-SA 3.0 IGO
https://www.esa.int/ESA_Multimedia/Images

2
3


The eye is first drawn, in this new NASA/ESA/CSA James Webb Space Telescope Picture of the Month, to the central mega-monster that is galaxy cluster Abell S1063. This behemoth collection of galaxies, lying 4.5 billion light-years from Earth in the constellation Grus (the Crane), dominates the scene. Looking more closely, this dense collection of heavy galaxies is surrounded by glowing streaks of light, and these warped arcs are the true object of scientists’ interest: faint galaxies from the Universe’s distant past.

Abell S1063 was previously observed by the NASA/ESA Hubble Space Telescope’s Frontier Fields programme. It features a strong gravitational lens: the galaxy cluster is so massive that the light of distant galaxies aligned behind it is bent around it, creating the warped arcs that we see here. Like a glass lens, it focuses the light from these faraway galaxies. The resulting images, albeit distorted, are both bright and magnified – enough to be observed and studied. This was the aim of Hubble’s observations, using the galaxy cluster as a magnifying glass to investigate the early Universe.

The new imagery from Webb’s Near-Infrared Camera (NIRCam) takes this quest even further back in time. This image showcases an incredible forest of lensing arcs around Abell S1063, which reveal distorted background galaxies at a range of cosmic distances, along with a multitude of faint galaxies and previously unseen features.

This image is what’s known as a deep field – a long exposure of a single area of the sky, collecting as much light as possible to draw out the most faint and distant galaxies that don’t appear in ordinary images. With 9 separate snapshots of different near-infrared wavelengths of light, totalling around 120 hours of observing time and aided by the magnifying effect of gravitational lensing, this is Webb’s deepest gaze on a single target to date. Focusing such observing power on a massive gravitational lens, like Abell S1063, therefore has the potential to reveal some of the very first galaxies formed in the early Universe.

The observing programme that produced this data, GLIMPSE (#3293, PIs: H. Atek & J. Chisholm), aims to probe the period known as Cosmic Dawn, when the Universe was only a few million years old.

[Image Description: A field of galaxies in space, dominated by an enormous, bright-white elliptical galaxy that is the core of a massive galaxy cluster. Many other elliptical galaxies can be seen around it. Also around it are short, curved, glowing red lines, which are images of distant background galaxies magnified and warped by gravitational lensing. A couple of foreground stars appear large and bright with long spikes around them.]

CREDIT

ESA/Webb, NASA & CSA, H. Atek, M. Zamani (ESA/Webb)

ACKNOWLEDGEMENTS

R. Endsley

https://www.esa.int/ESA_Multimedia/Images/2025/05/Webb_glimpses_the_distant_past

4
5
6


The smooth topped, rounded flows seen extending from the base of the crater wall are ‘debris aprons’: remnants of rock-covered glaciers that likely formed when the martian climate allowed ice to accumulate at the mid-latitudes of Mars. Over time, the debris-covered glaciers slowly crept downslope to form the gently sloping bulges seen today.

The erosive action of ice and water has resulted in the considerable widening of the crater of up to twice its original size.

A particularly dramatic example is seen at the right edge of this image, where a wide channel has been gouged out. It is reminiscent of the U-shaped valleys carved by glaciers on Earth. Here, it may have started out in a V-shape due to flowing water – or water draining out from beneath and causing collapse – and later widened during a period of glaciation.

The oblique perspective view was generated from the digital terrain model, the nadir and colour channels of the High Resolution Stereo Camera on ESA’s Mars Express from data collected 25 October 2024.

[Image description: A sweeping view along the crater rim of Deuteronilus Cavus, which transects the image from bottom right to centre-top, focuses on the smooth debris flows that have slid towards the centre of the crater. At the right, a large chunk of the crater wall is missing, forming a U-shaped valley with a grooved floor. Towards the centre of the crater – the far top left of the image – a patch of dark volcanic dust covers the surface. Jumbled blocks are seen in the centre, contrasting the smoother flows around the inner walls.]

CREDIT

ESA/DLR/FU Berlin

https://www.esa.int/Science_Exploration/Space_Science/Mars_Express/Recipe_for_a_rocky_road_crater_soaked_in_martian_history

7
submitted 1 year ago by [M] to c/space@beehaw.org


Photographing the Milky Way is a journey through time, space, and imagination.

While we can only see a small part of the Milky Way with our own eyes, photography allows us to uncover its hidden beauty—showing details, colors, and patterns in the night sky that usually go unnoticed. But beyond the camera and technique, it’s the photographer’s creativity, patience, and sense of wonder that truly bring these images to life.

Now in its 8th edition, our Milky Way Photographer of the Year brings together 25 of the most stunning night sky images captured around the world—and beyond. This year’s collection features a unique Milky Way image taken from space aboard the International Space Station, alongside captivating views from rarely photographed locations such as Chad, Northern Argentina, Socotra Island, Namibia, Australia, New Zealand, and more.

You’ll also see the Milky Way paired with celestial events like a comet, a meteor shower, and a lunar eclipse, showing just how dynamic and magical our night sky can be.

Get ready for an interstellar journey through deserts, mountains, islands, and skies unlike any you’ve seen before—always with the Milky Way as your guide.

8
9
10
11
12
Cas A (MIRI image) (www.esa.int)
submitted 1 year ago by to c/space@beehaw.org


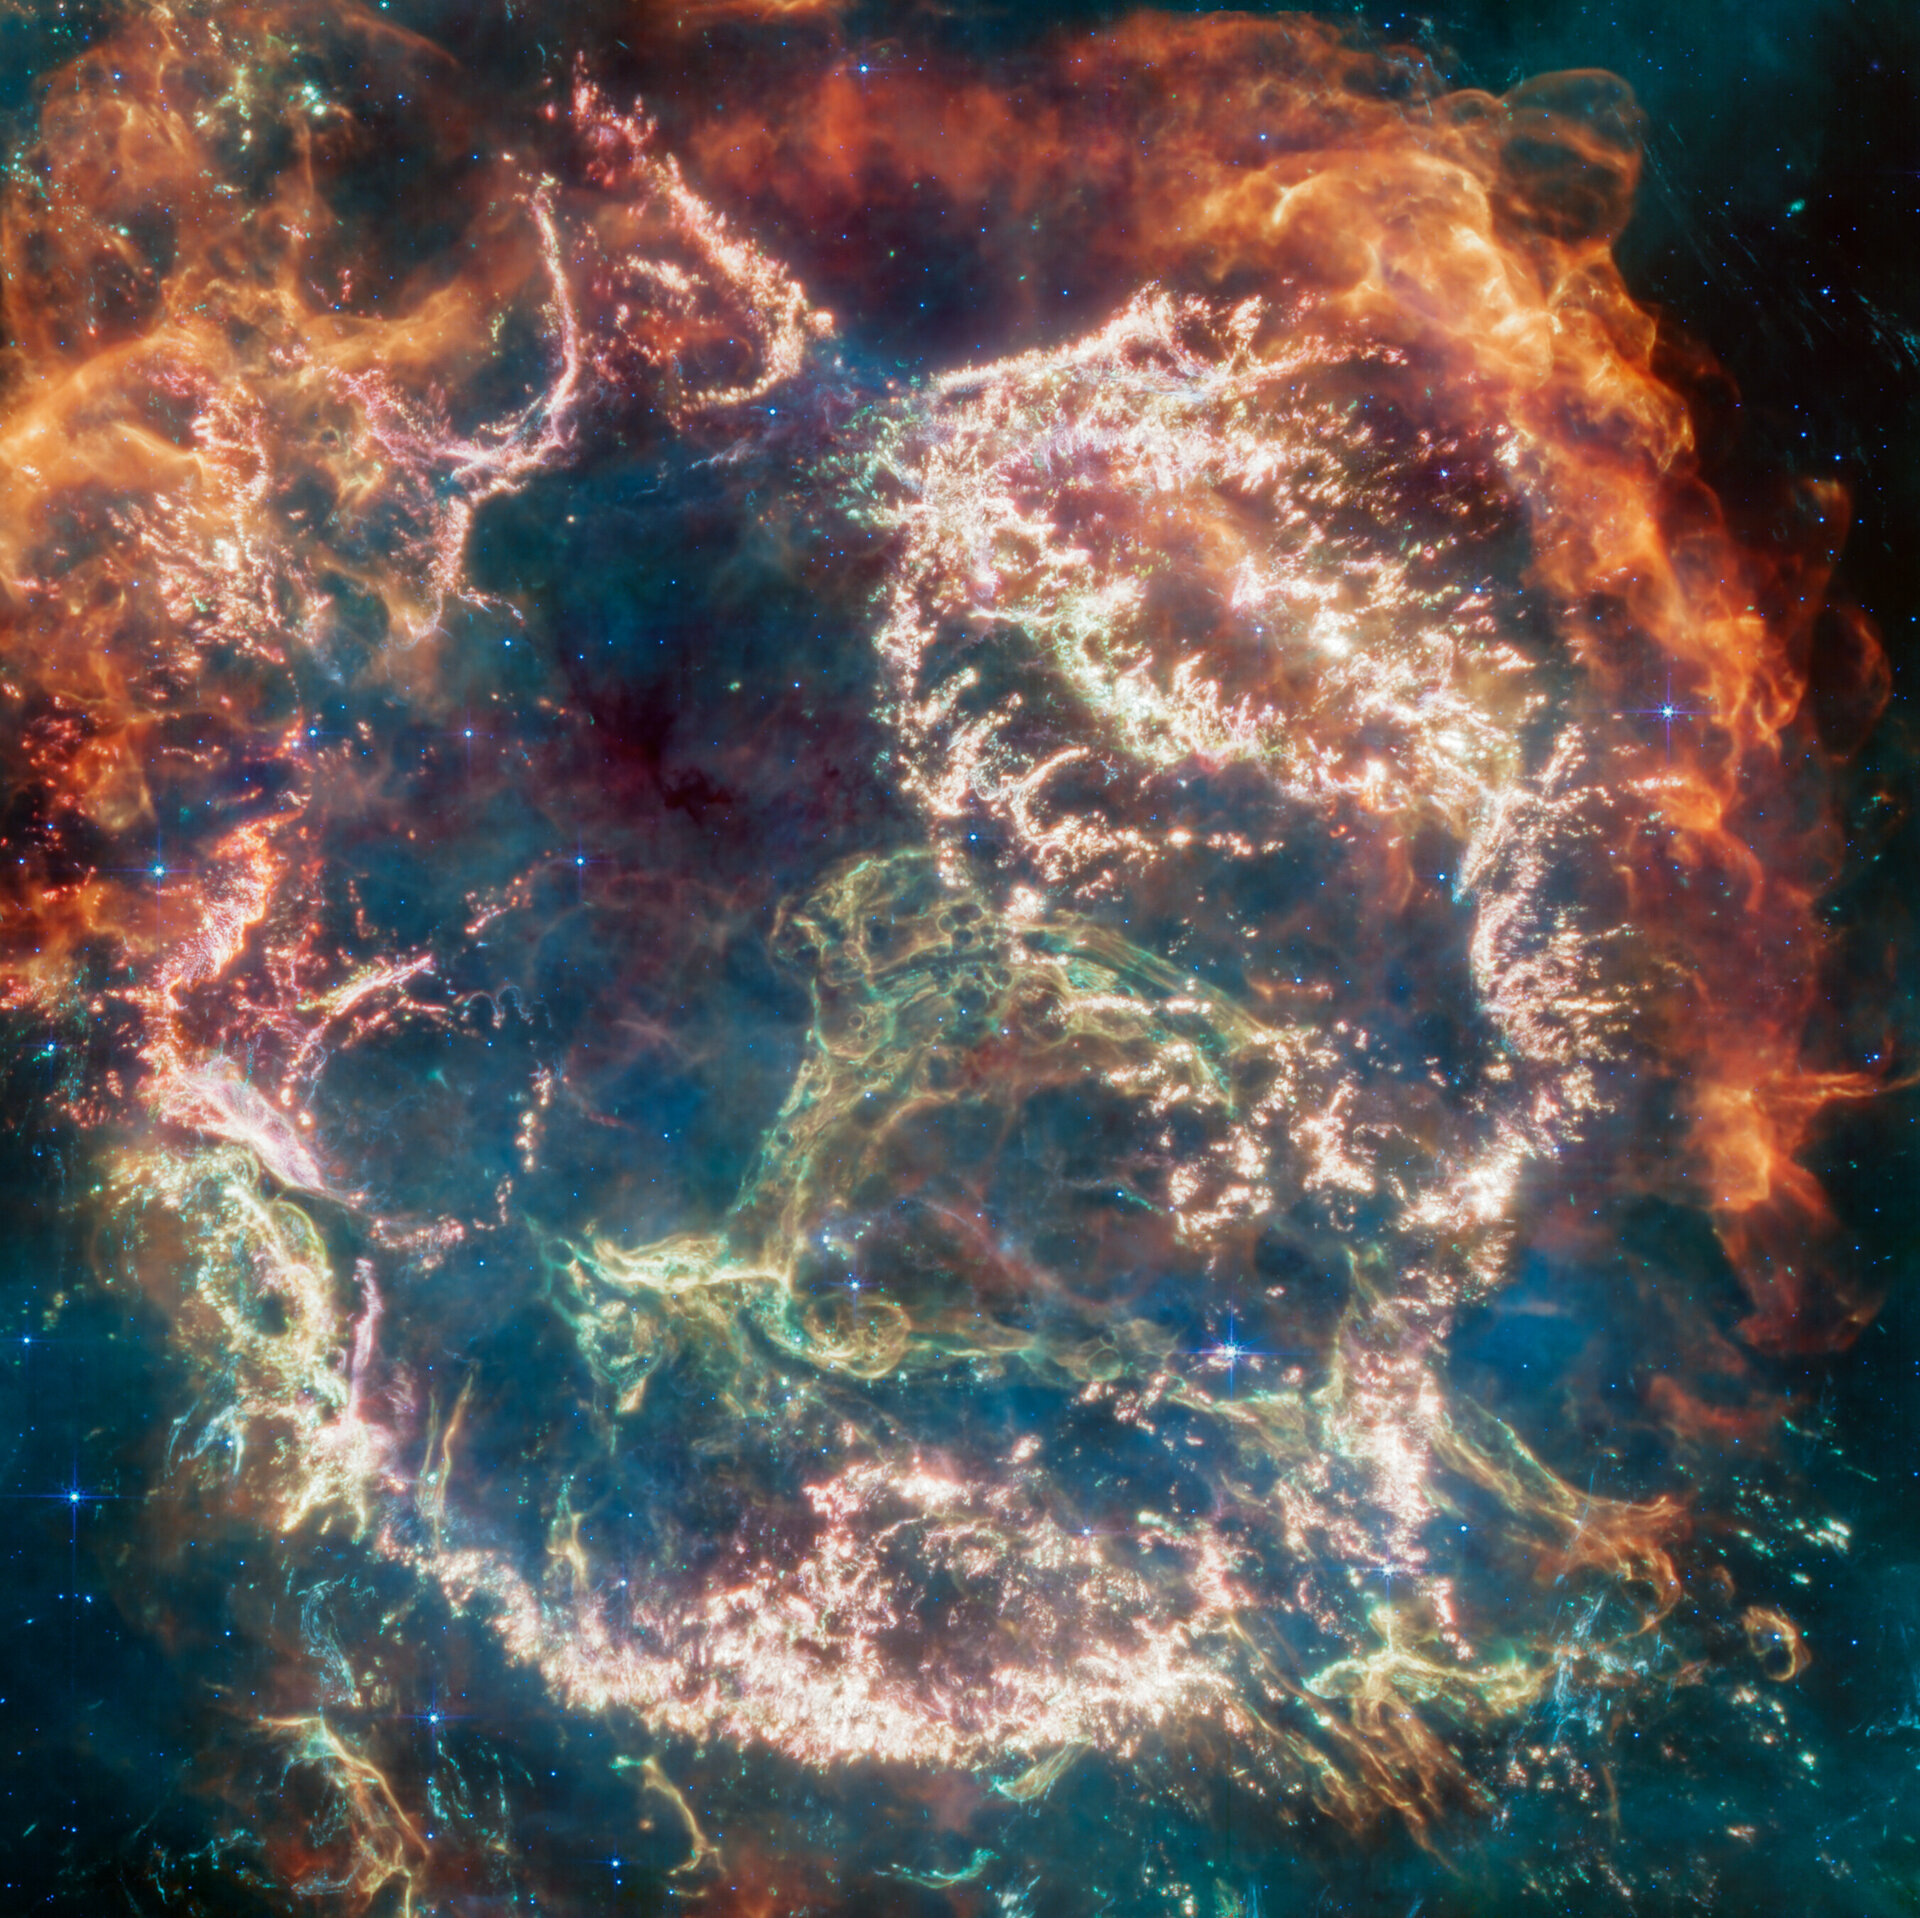
Cassiopeia A (Cas A) is a supernova remnant located about 11 000 light-years from Earth in the constellation Cassiopeia. It spans approximately 10 light-years. This image, released in April 2023, uses data from Webb’s Mid-Infrared Instrument (MIRI) to reveal Cas A in a new light.

On the remnant’s exterior, particularly at the top and left, lie curtains of material, appearing orange and red, that are due to emission from warm dust. This marks where ejected material from the exploded star is ramming into surrounding circumstellar material.

Interior to this outer shell lie mottled filaments of bright pink studded with clumps and knots. This is material from the star itself, and likely shines due to a mix of various heavy elements and dust emission. The stellar material can also be seen as fainter wisps near the cavity’s interior.

A loop represented in green extends across the right side of the central cavity. Its shape and complexity are unexpected and challenging for scientists to understand.

[Image description: A roughly square image is rotated clockwise about 45 degrees. Within the image is a roughly circular nebula with a complex structure. On the circle’s exterior lie curtains of material glowing orange. Interior to this outer shell lies a ring of mottled filaments of bright pink studded with clumps and knots. At centre right, a greenish loop extends from the right side of the ring into the central cavity. Translucent wisps of blue, green, and red appear throughout the image.]

CREDIT

NASA, ESA, CSA, D. Milisavljevic (Purdue University), T. Temim (Princeton University), I. De Looze (UGent), J. DePasquale (STScI)

13
14
15
submitted 1 year ago by to c/space@beehaw.org


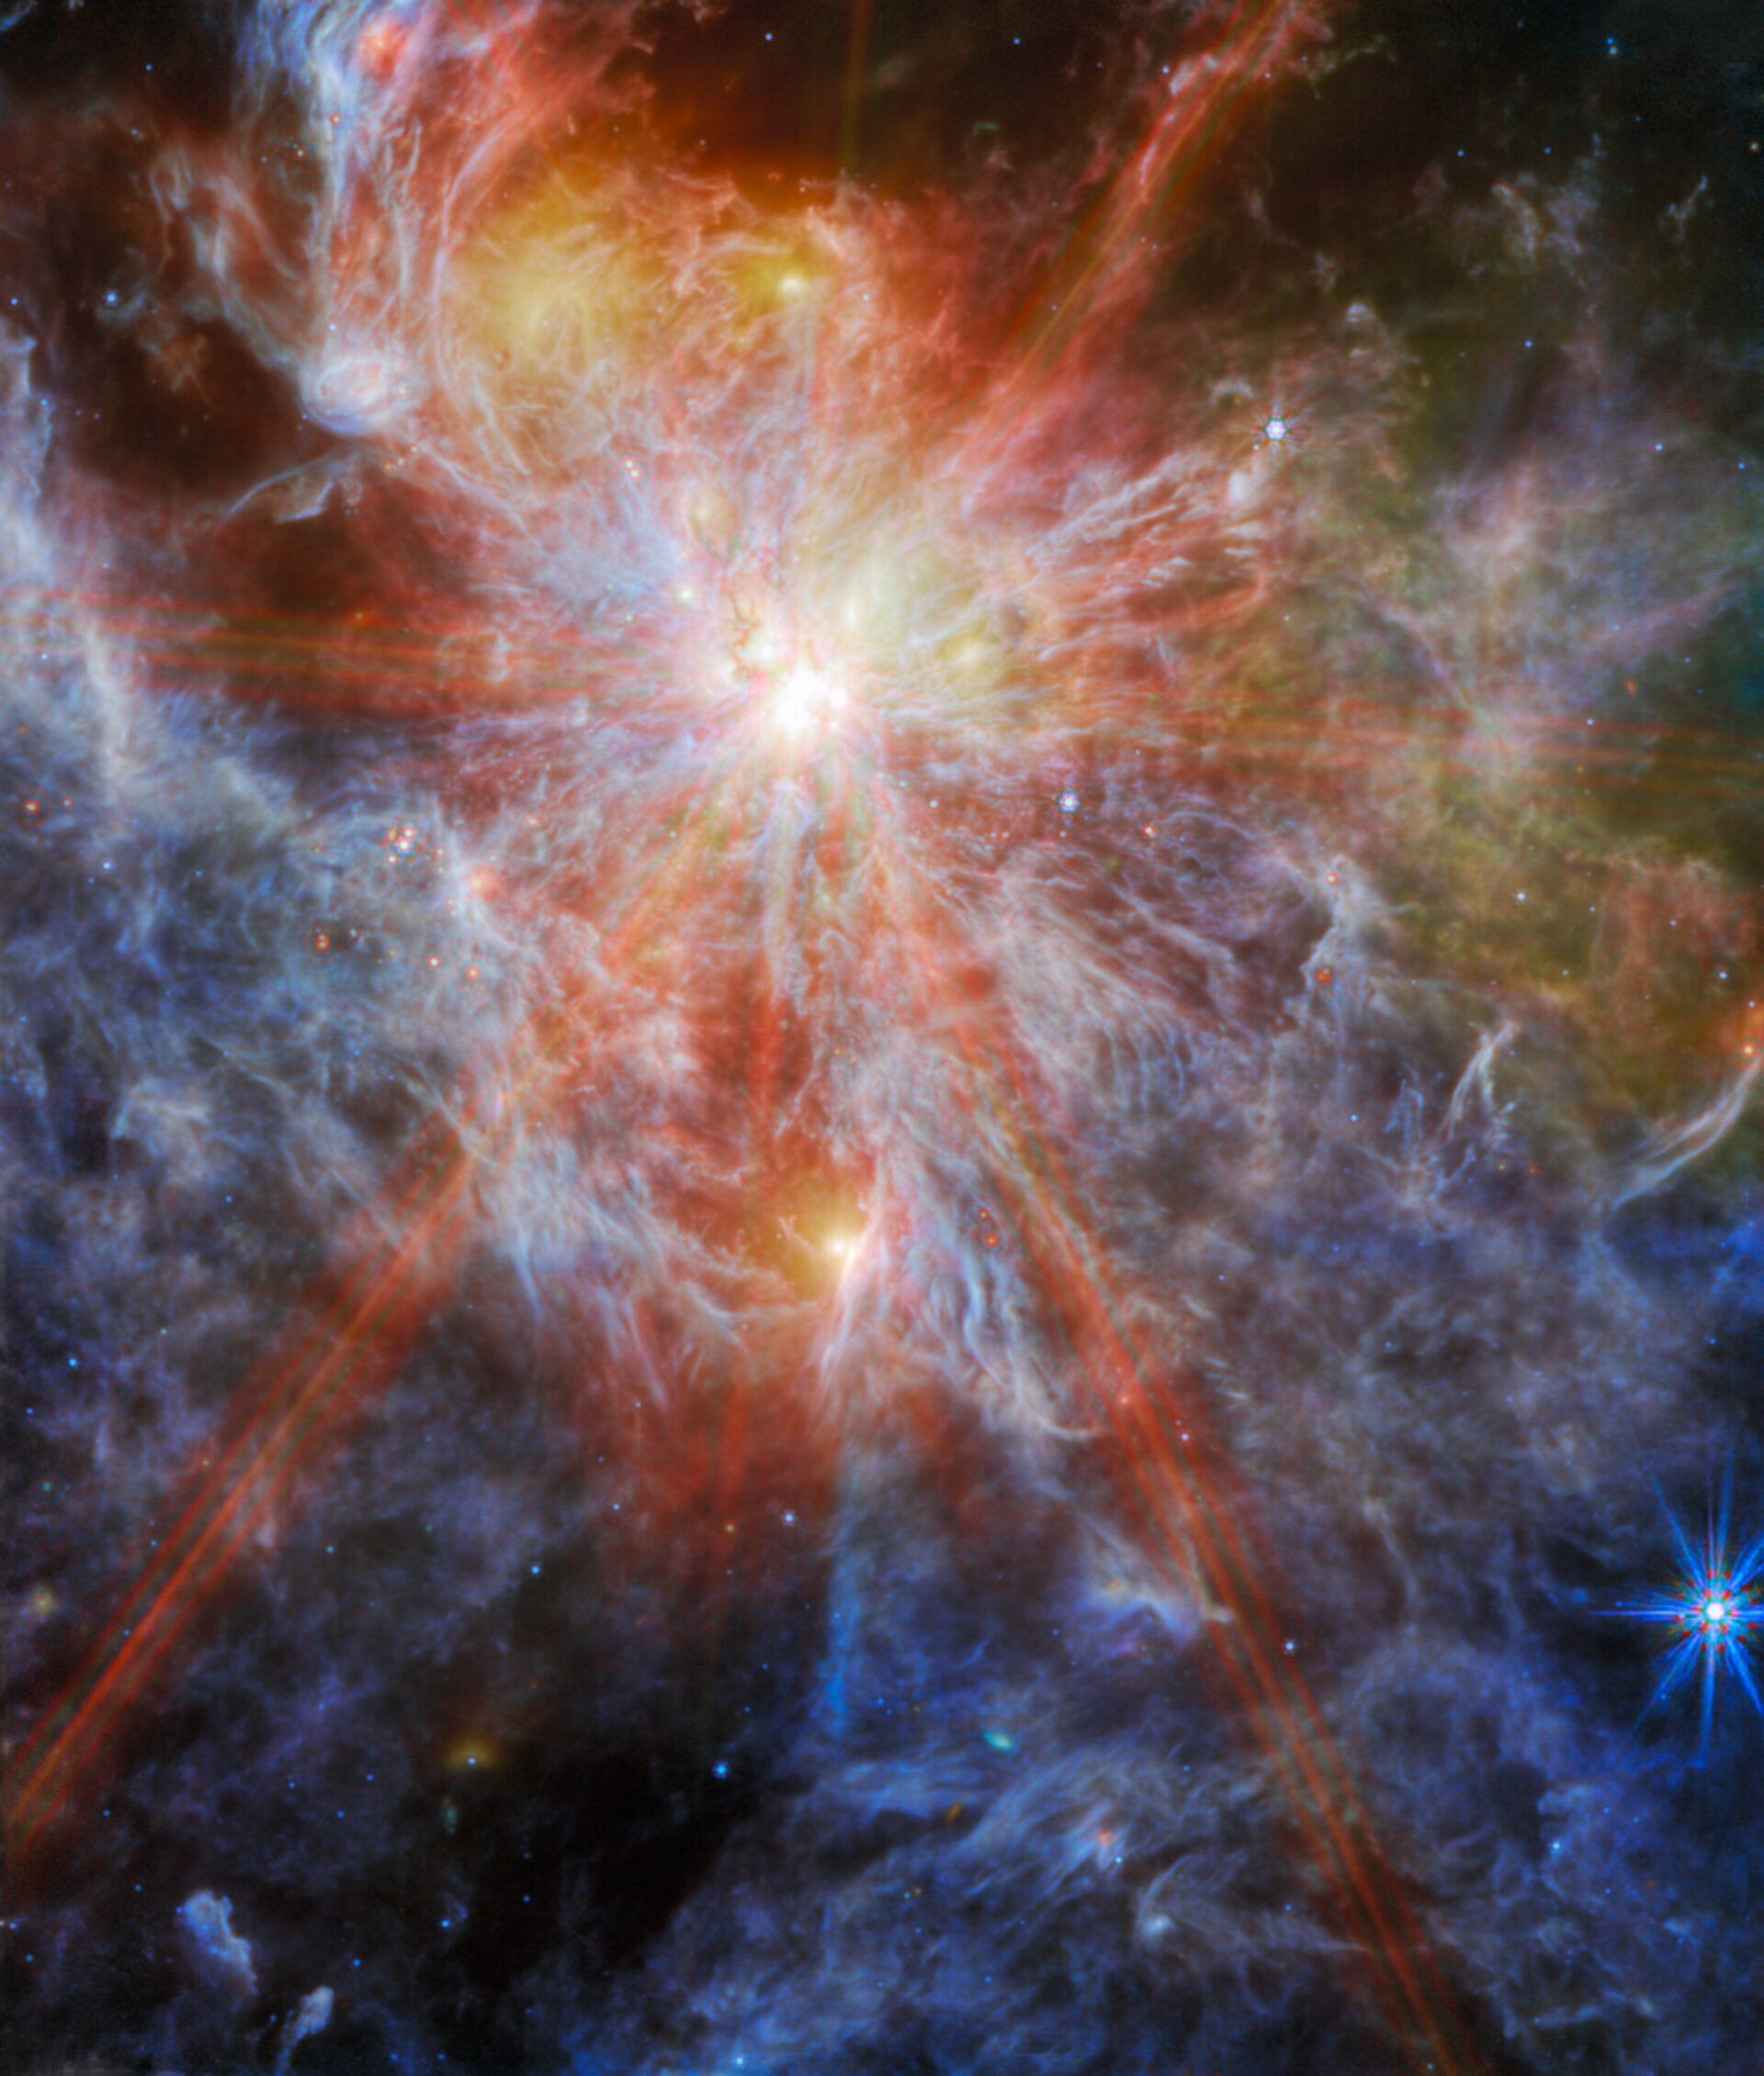
This image from the NASA/ESA/CSA James Webb Space Telescope features an H II region in the Large Magellanic Cloud (LMC), a satellite galaxy of our Milky Way. This nebula, known as N79, is a region of interstellar atomic hydrogen that is ionised, captured here by Webb’s Mid-InfraRed Instrument (MIRI).

N79 is a massive star-forming complex spanning roughly 1630 light-years in the generally unexplored southwest region of the LMC. N79 is typically regarded as a younger version of 30 Doradus (also known as the Tarantula Nebula), another of Webb’s recent targets. Research suggests that N79 has a star formation efficiency exceeding that of 30 Doradus by a factor of two over the past 500 000 years.

This particular image centres on one of the three giant molecular cloud complexes, dubbed N79 South (S1 for short). The distinct ‘starburst’ pattern surrounding this bright object is a series of diffraction spikes. All telescopes which use a mirror to collect light, as Webb does, have this form of artifact which arises from the design of the telescope. In Webb's case, the six largest starburst spikes appear because of the hexagonal symmetry of Webb's 18 primary mirror segments. Patterns like these are only noticeable around very bright, compact objects, where all the light comes from the same place. Most galaxies, even though they appear very small to our eyes, are darker and more spread out than a single star, and therefore do not show this pattern.

At the longer wavelengths of light captured by MIRI, Webb’s view of N79 showcases the region’s glowing gas and dust. This is because mid-infrared light is able to reveal what is happening deeper inside the clouds (while shorter wavelengths of light would be absorbed or scattered by dust grains in the nebula). Some still-embedded protostars also appear in this field.

Star-forming regions such as this are of interest to astronomers because their chemical composition is similar to that of the gigantic star-forming regions observed when the Universe was only a few billion years old and star formation was at its peak. Star-forming regions in our Milky Way galaxy are not producing stars at the same furious rate as N79, and have a different chemical composition. Webb is now providing astronomers the opportunity to compare and contrast observations of star formation in N79 with the telescope’s deep observations of distant galaxies in the early Universe.

These observations of N79 are part of a Webb programme that is studying the evolution of the circumstellar discs and envelopes of forming stars over a wide range in mass and at different evolutionary stages. Webb’s sensitivity will enable scientists to detect for the first time the planet-forming dust discs around stars of similar mass to that of our Sun at the distance of the LMC.

This image includes 7.7-micron light shown in blue, 10 microns in cyan, 15 microns in yellow, and 21 microns in red (770W, 1000W, 1500W, and 2100W filters, respectively).

[Image description: A bright young star within a colourful nebula. The star is identifiable as the brightest spot in the image, surrounded by six large spokes of light that cross the image. A number of other bright spots can also be seen in the clouds, which are shown in great detail as layers of colourful wisps.]

CREDIT

ESA/Webb, NASA & CSA, M. Meixner

https://www.esa.int/ESA_Multimedia/Images/2024/01/A_massive_cluster_is_born

16


A beautiful but skewed spiral galaxy dazzles in today’s NASA/ESA Hubble Space Telescope Picture of the Week. This galaxy, called Arp 184 or NGC 1961, sits about 190 million light-years away from Earth in the constellation Camelopardalis (The Giraffe).

The name Arp 184 comes from the Atlas of Peculiar Galaxies, which was compiled by astronomer Halton Arp in 1966. The 338 galaxies in the atlas are oddly shaped, tending to be neither entirely elliptical nor entirely spiral-shaped. Many of the galaxies are in the process of interacting with other galaxies, while others are dwarf galaxies without well-defined structures. Arp 184 earned its spot in the catalogue thanks to its single broad, star-speckled spiral arm that appears to stretch toward us. The galaxy’s far side sports a few wisps of gas and stars but lacks a similarly impressive spiral arm.

This Hubble image combines data from three Snapshot observing programmes, which are composed of short observations that can be slotted into time gaps between other proposals. One of the three programmes targeted Arp 184 for its peculiar appearance. This programme surveyed galaxies listed in the Atlas of Peculiar Galaxies as well as A Catalogue of Southern Peculiar Galaxies and Associations, a similar catalogue compiled by Halton Arp and Barry Madore.

The remaining two programmes were designed to check up on the aftermath of fleeting astronomical events like supernovae and tidal disruption events — when a star is ripped apart after wandering too close to a supermassive black hole. Since Arp 184 has hosted four known supernovae in the past three decades, it’s a rich target for a supernova hunt.

[Image Description: A spiral galaxy seen at a skewed angle. Its centre is a bright spot radiating light. A thick, stormy disc of material surrounds this, with swirling strands of dark dust and bright spots of star formation strewn through the disc. A large spiral arm extends from the disc towards the viewer. Some foreg

CREDIT

ESA/Hubble & NASA, J. Dalcanton, R. J. Foley

(UC Santa Cruz), C. Kilpatrick

https://www.esa.int/About_Us/Week_in_images/Week_in_images_28_April_-_02_May_2025

Comment: I do not know why the last sentence in their description ends with an incomplete sentence.

17
18


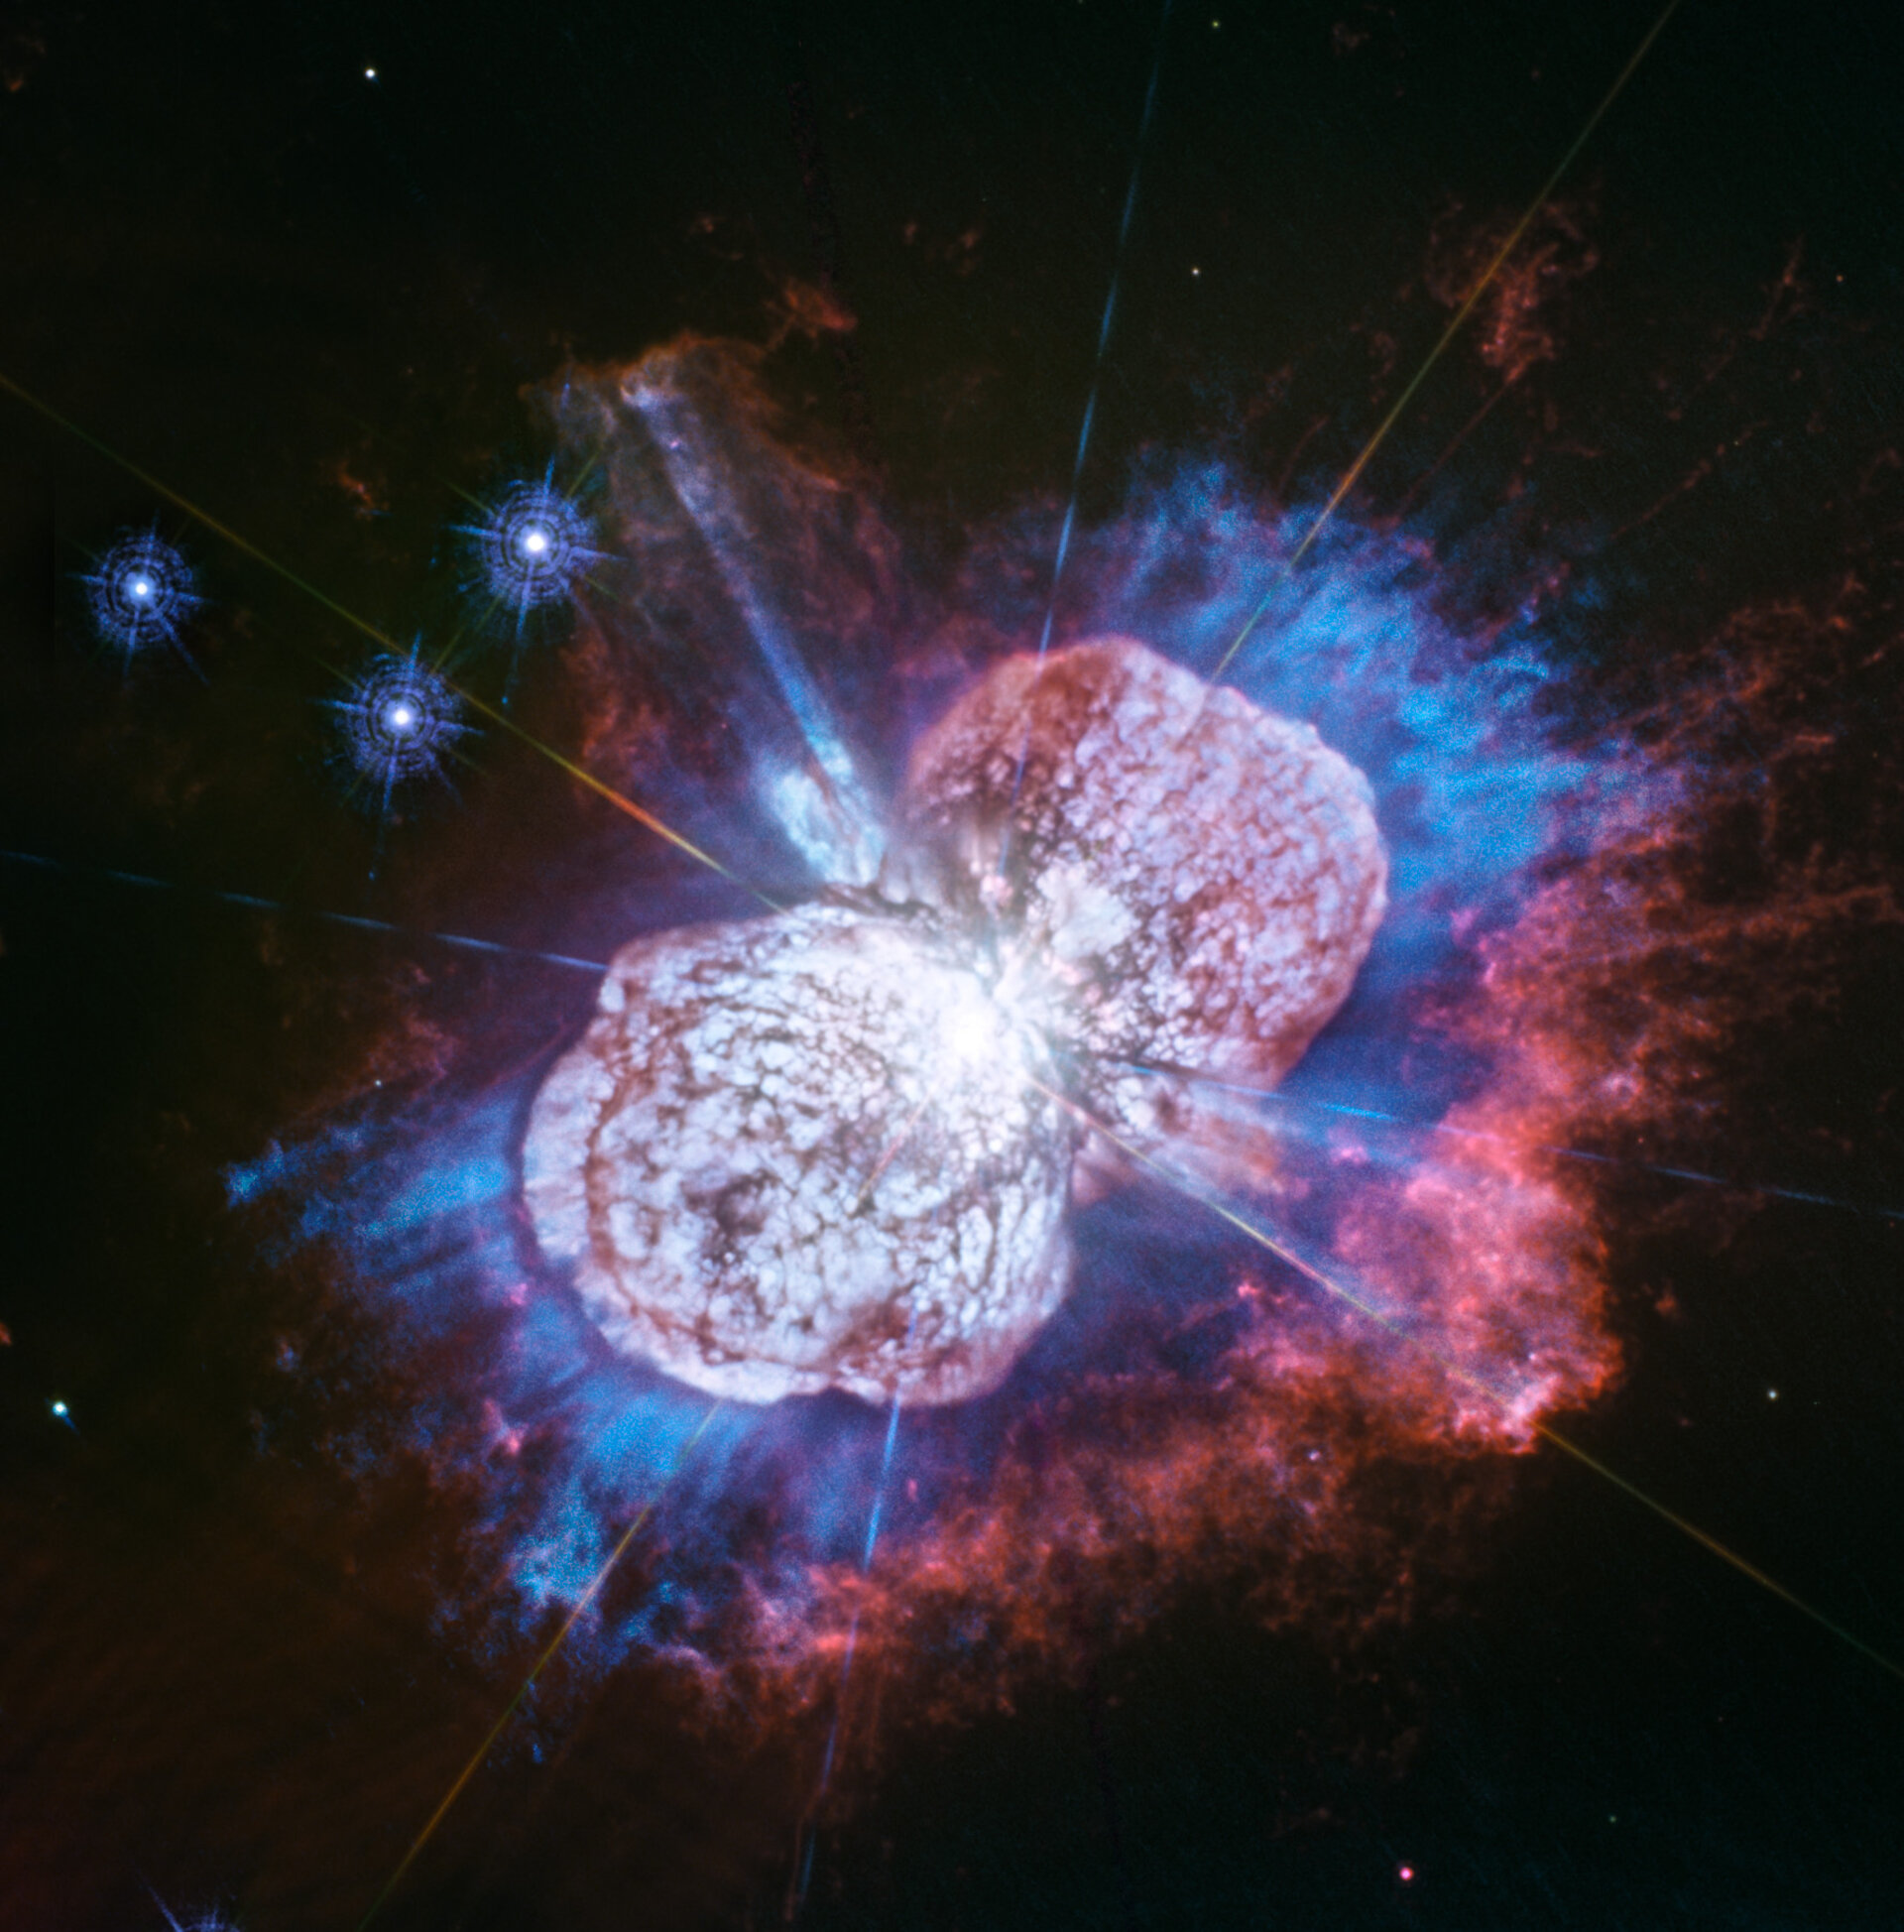
Telescopes, including Hubble, have monitored the Eta Carinae star system for more than two decades. It has been prone to violent outbursts, including an episode in the 1840s during which ejected material formed the bipolar bubbles seen here.

Now, using Hubble’s Wide Field Camera 3 to probe the nebula in ultraviolet light, astronomers have uncovered the glow of magnesium embedded in warm gas (shown in blue) in places they had not seen it before. The luminous magnesium resides in the space between the dusty bipolar bubbles and the outer shock-heated nitrogen-rich filaments (shown in red). The streaks visible in the blue region outside the lower-left lobe are a striking feature of the image. These streaks are created when the star’s light rays poke through the dust clumps scattered along the bubble’s surface. Wherever the ultraviolet light strikes the dense dust, it leaves a long, thin shadow that extends beyond the lobe into the surrounding gas.

Eta Carinae resides 7500 light-years away.

CREDIT

NASA, ESA, N. Smith (University of Arizona, >Tucson), and J. Morse (BoldlyGo Institute, New York); CC BY 4.0

https://www.esa.int/ESA_Multimedia/Search?SearchText=carina&amp%3Bresult_type=images

19


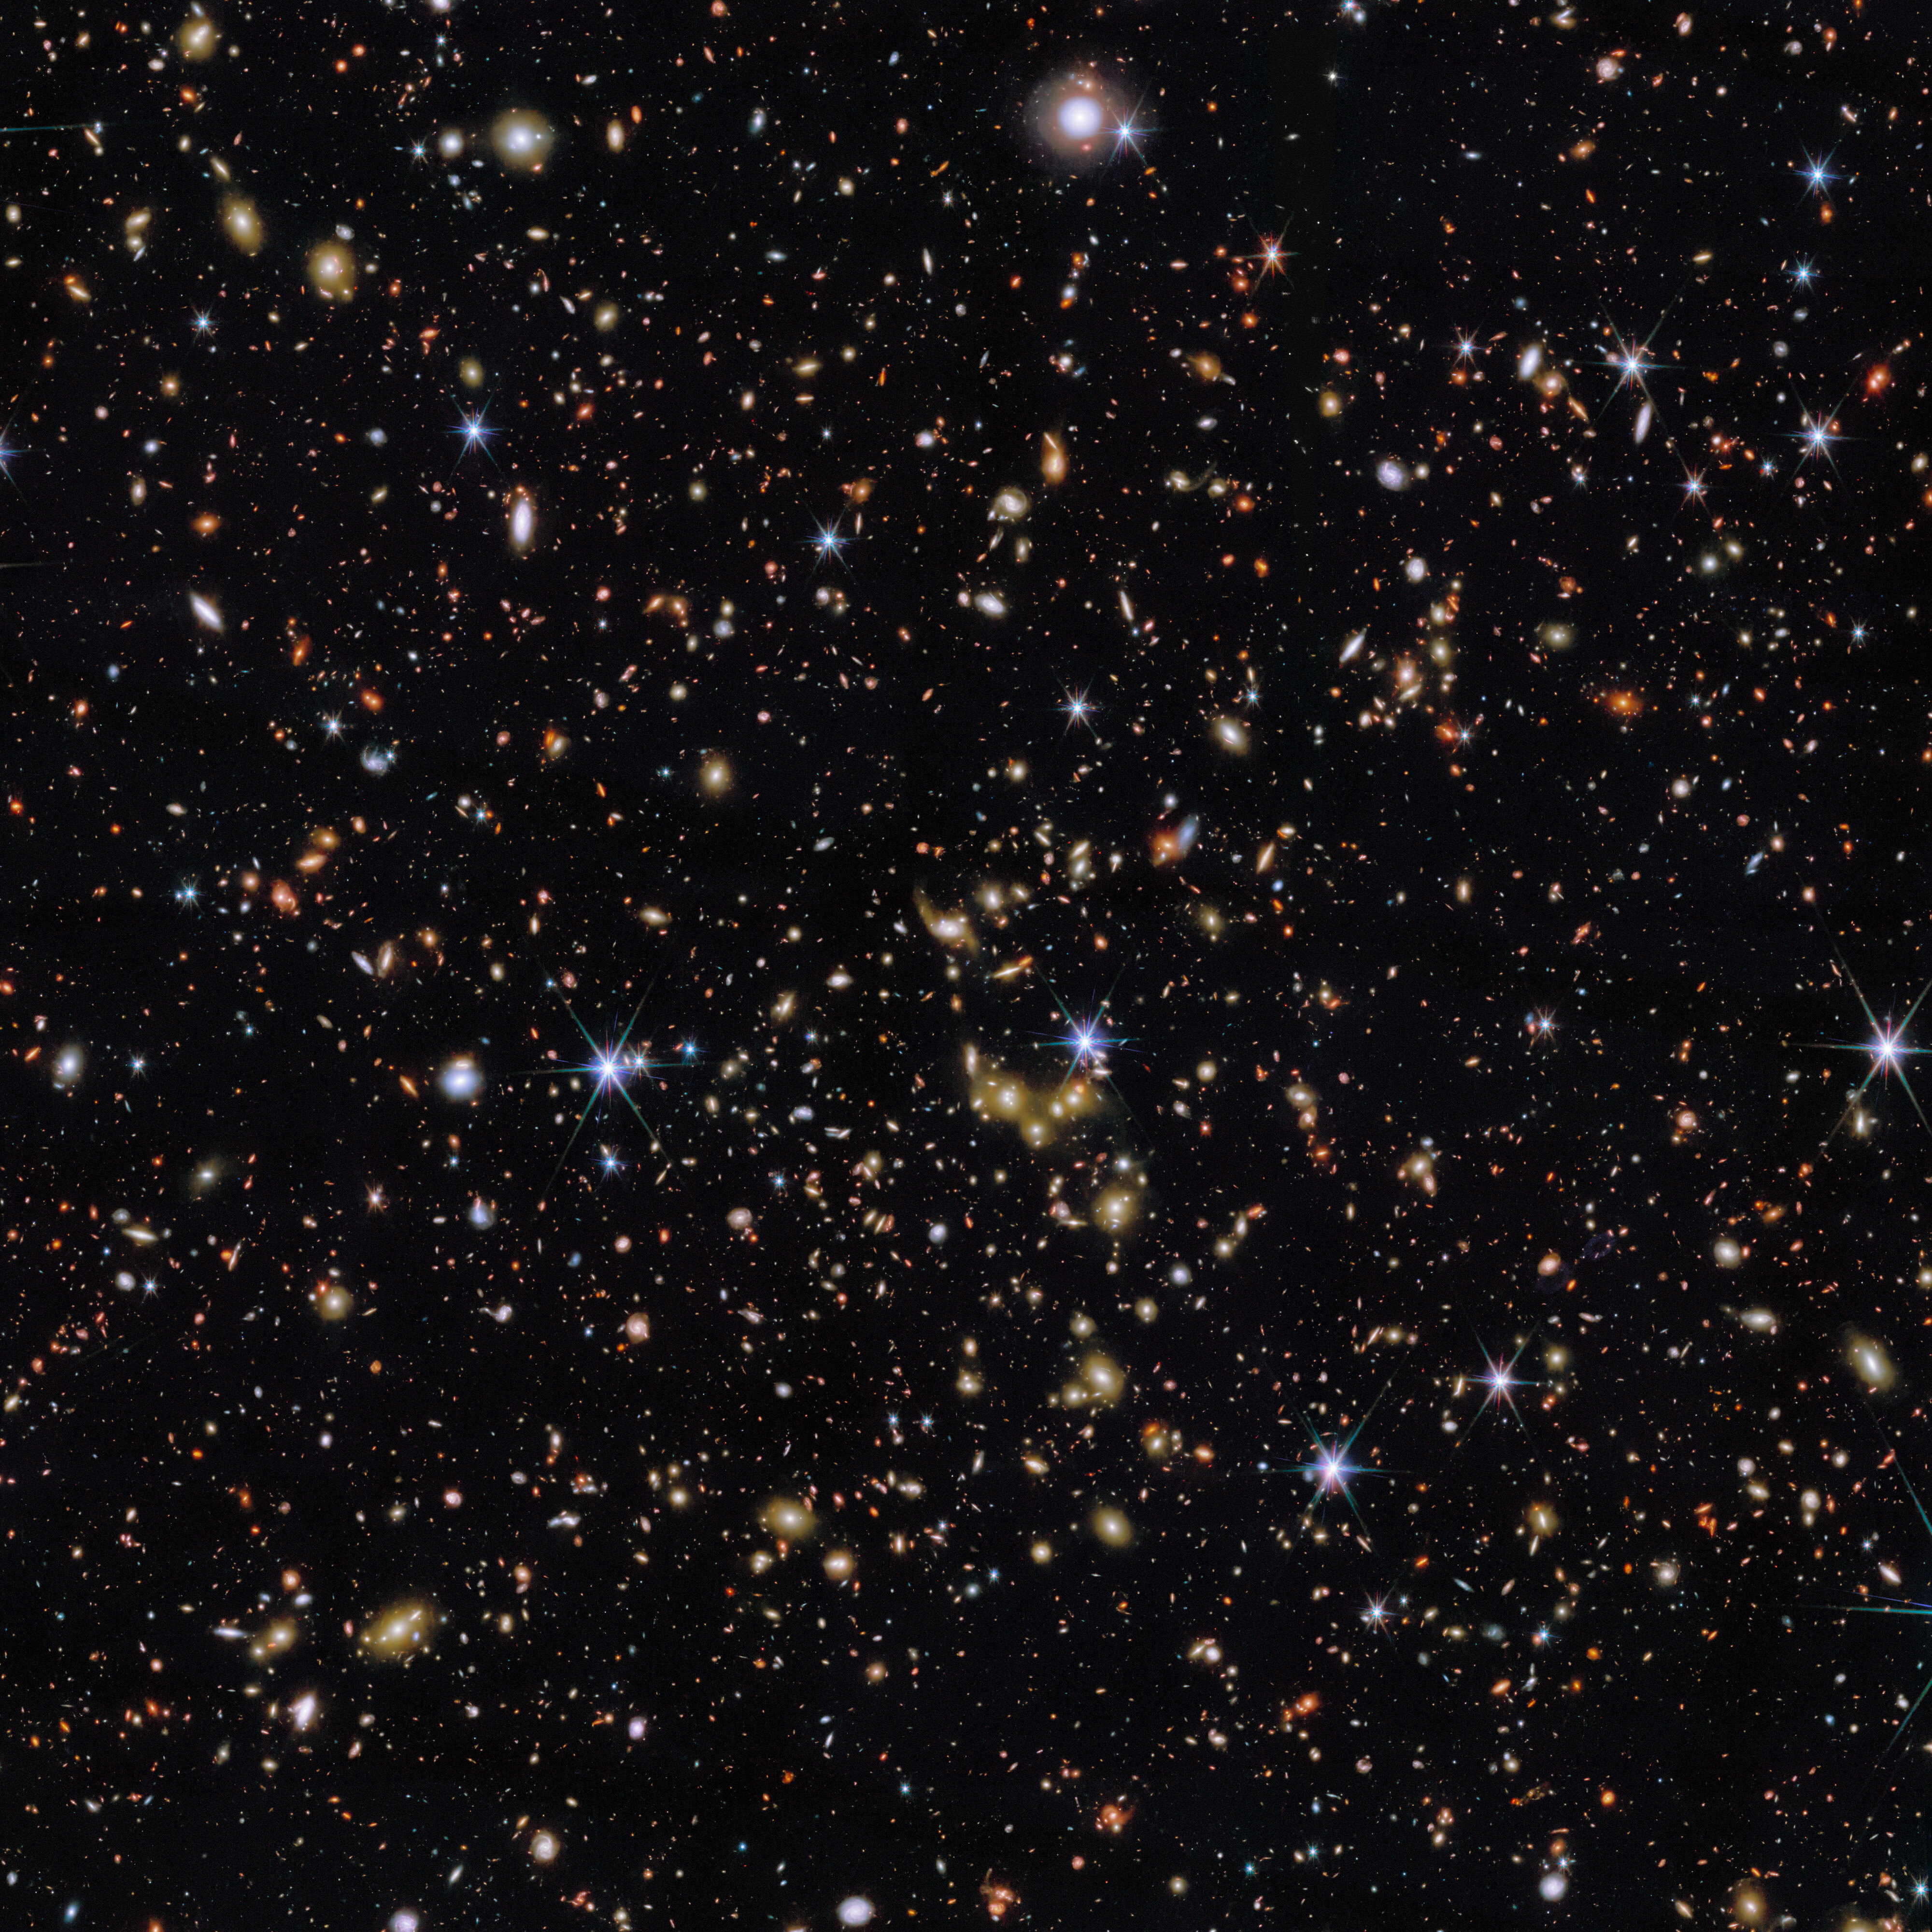
[Image Description: An area of deep space with thousands of galaxies in various shapes and sizes on a black background. Most are circles or ovals, with a few spirals. More distant galaxies are redder in colour and smaller, down to being mere dots, while closer galaxies are a bit larger and white or blueish. A few gold-coloured galaxies are bunched closely together in the centre. Bright stars surrounded by spikes lie in our galaxy.]

https://esawebb.org/images/potm2504a/

https://cosmos.astro.caltech.edu/page/cosmosweb

20


ESA’s state-of-the-art Biomass satellite has launched aboard a Vega-C rocket from Europe’s Spaceport in French Guiana. The rocket lifted off on 29 April 2025 at 11:15 CEST (06:15 local time).

In orbit, this latest Earth Explorer mission will provide vital insights into the health and dynamics of the world’s forests, revealing how they are changing over time and, critically, enhancing our understanding of their role in the global carbon cycle. It is the first satellite to carry a fully polarimetric P-band synthetic aperture radar for interferometric imaging. Thanks to the long wavelength of P-band, around 70 cm, the radar signal can slice through the whole forest layer to measure the ‘biomass’, meaning the woody trunks, branches and stems, which is where trees store most of their carbon.

Vega-C is the evolution of the Vega family of rockets and delivers increased performance, greater payload volume and improved competitiveness.

CREDIT

ESA - S.Corvaja

21
submitted 1 year ago by to c/space@beehaw.org
22
submitted 1 year ago* by to c/space@beehaw.org


This animation shows how Solar Orbiter obtains its high-resolution full Sun views. While both the Extreme Ultraviolet Imager (EUI) and Polarimetric and Helioseismic Imager (PHI) instruments on the spacecraft are capable of imaging the entire Sun in a single shot, their high-resolution cameras only cover a small patch of the Sun at any one time.

To get a high-resolution view of the full solar disc, Solar Orbiter is first oriented to point to different regions across the Sun, usually in a 5 x 5 grid, with images taken at each pointing direction. These are then stitched together to create a much larger ‘mosaic’.

Shown here is how this was done on 9 March 2025. The animation shows the Sun as seen by EUI's Full Sun Imager. At each pointing direction, highlighted by the dark squares, the EUI instrument captured six images at high resolution and two wide-angle views. These 200 individual images were then combined to create the widest high-resolution image of the Sun yet. Combining multiple images at each pointing direction improves the brightness and sharpness of the final image.

The green-red grid overlaid on the Sun shows the solar latitude and longitude lines, with the blue (red) vertical line indicating the Sun's south (north) pole. The crossing point of the thick yellow lines is the midpoint of Earth's view. Meanwhile, Solar Orbiter was viewing the Sun from a south solar latitude of 11.4 degrees at around 77 million km from the Sun.

On the bottom left of the animation you can see the date and time (in UTC), the distance of the spacecraft to the centre of the Sun in astronomical units (1 AU = 150 million km), and the field of view of the EUI Full Sun Imager in solar radii (1 R☉ = 696 000 km).

Solar Orbiter is a space mission of international collaboration between ESA and NASA. The Extreme Ultraviolet Imager (EUI) instrument is led by the Royal Observatory of Belgium (ROB).

[Video description: On a black background, the Sun looks like a slowly rotating warm yellow sphere with a surface covered with glowing messy hair. Moving, bright yellow arcs extend from the Sun's surface, while other regions look dark. Overlaid on this image are red-green dashed lattitude-longitude lines and a set of solid yellow lines at 0° longitude and −7.2° latitude. A vertical blue line extends from the Sun's south pole, and a red line from the north pole. As time progresses, a dark square moves from the northwest of the Sun down to the southwest in five steps, then repeats this one step to the east until it has covered all of the Sun's disc in a 5 x 5 grid.]

CREDIT ESA & NASA/Solar Orbiter/EUI Team, D. Berghmans (ROB)

https://www.esa.int/ESA_Multimedia/Sets/Solar_Orbiter_s_full_Sun_views/(result_type)/images

CREDIT ESA & NASA/Solar Orbiter/EUI Team, E. Kraaikamp (ROB)

23
Artemis - NASA (www.nasa.gov)
submitted 1 year ago by [M] to c/space@beehaw.org


I had no idea of this project from NASA. I don't understand why the national media has not covered this. I only just found out about it by watching a recent video by Peter Santenello.

24
25
view more: next ›