1


cross-posted from: https://mander.xyz/post/55196744

Record-breaking dust storms sent pollution levels soaring in China and the US-Mexico border region in 2025, disrupting transport, shutting schools and airports, and sending thousands to emergency rooms, according to a new World Meteorological Organization (WMO) report.

Overall, average dust concentrations in 2025 were similar to the previous year, but the regional extremes were severe, the WMO Airborne Dust Bulletin found. It is the tenth in the annual series.

Around 2,000 million tonnes of dust enter the atmosphere each year, with dust storms now affecting more than 150 countries forcing schools, highways and airports to shut down.

“More than 80% of [global dust] originates from the North African and Middle Eastern deserts and can be transported for hundreds and even thousands of kilometres across continents and oceans,” WMO said. “Much of this is a natural process, but poor water and land management, drought and environmental degradation are increasingly to blame.”

...

In East Asia, dust swept from Mongolia across most of China from 10 to 14 April in the country’s most extensive sand and dust storm in a decade, ranked by intensity, reach and duration, WMO said.

The desert border region of Mexico and the United States saw exceptionally frequent, intense and prolonged storms. El Paso, Texas experienced 50 days of dust weather in 2025, more than double the annual average as its 12 dust storms were the most since 1935, at the height of the Dust Bowl.

...

Web Archive link

2


cross-posted from: https://hexbear.net/post/9013921

cross-posted from: https://news.abolish.capital/post/63687

It’s barely the middle of summer in the northern hemisphere, and heatwaves are once again breaking temperature records.

In the United States, dozens of cities sweltered through their hottest Fourth of July celebrations, with temperatures over 100 degrees Fahrenheit. In New Jersey alone, dozens died from the heat over the weekend. European authorities have linked thousands of deaths during the end of June to heat-related causes. And on Thursday, the European Union’s Copernicus Climate Change Service announced that Western Europe had experienced the hottest June ever recorded in the region.

The seas are running a fever, too. It was also the hottest June on record for the world’s oceans, according to Copernicus. Nearly 40 percent of ocean area worldwide is undergoing a marine heatwave, with intense hot patches in the Mediterranean Sea and the Pacific Ocean more than 10 degrees Fahrenheit hotter than usual. It’s the latest in a wave of ocean warming that began in 2023, fueling devastating cyclones and damaging the majority of the planet’s coral reefs.

As humans burn fossil fuels, the oceans absorb more than 90 percent of the excess heat trapped by the resulting greenhouse gases, causing them to warm. Waters at the surface also exchange heat and moisture with the atmosphere, helping to drive hotter temperatures and more extreme weather. A recent study found that at least a fifth of heatwaves on land begin in the ocean.

“Heat is one of the features of climate change that has already arrived,” said Ruth Engel, a data scientist for environmental health and extreme heat with the World Resources Institute. “It’s not something we need to prepare for 25 years from now. It’s already a deadly health issue now.”

In mild climates and historically hot ones alike, extreme heat has become an expected part of summer, Engel said. Last year, more people died from extreme heat than from road crashes in Europe, she added.

Because weather, climate, and oceans are so intertwined, it can take months for scientists to pinpoint the cause of any one heat event. But there are some early clues that can help researchers connect weather events to ocean heatwaves, said Zachary Labe, a scientist at Climate Central, a research nonprofit.

For example, scientists suspect that the recent heatwaves across Europe are tied to extra-warm temperatures in the Mediterranean Sea, he said. And the high temperatures and humidity causing Floridians to crank up their air-conditioners are probably related to a marine heatwave with water temperatures near 90 degrees F off the state’s Gulf coast. Unusually warm temperatures in the Pacific Ocean may have helped set up a weather pattern driving a potentially record-breaking heatwave forecast for the central and northern U.S. in the coming week, he said.

“The current patterns that are creating these heat domes are similar to those we’ve seen before,” Labe said.  “But climate change is just acting to boost everything.” Essentially, warmer global temperatures mean worse consequences when extreme weather does hit, he said.
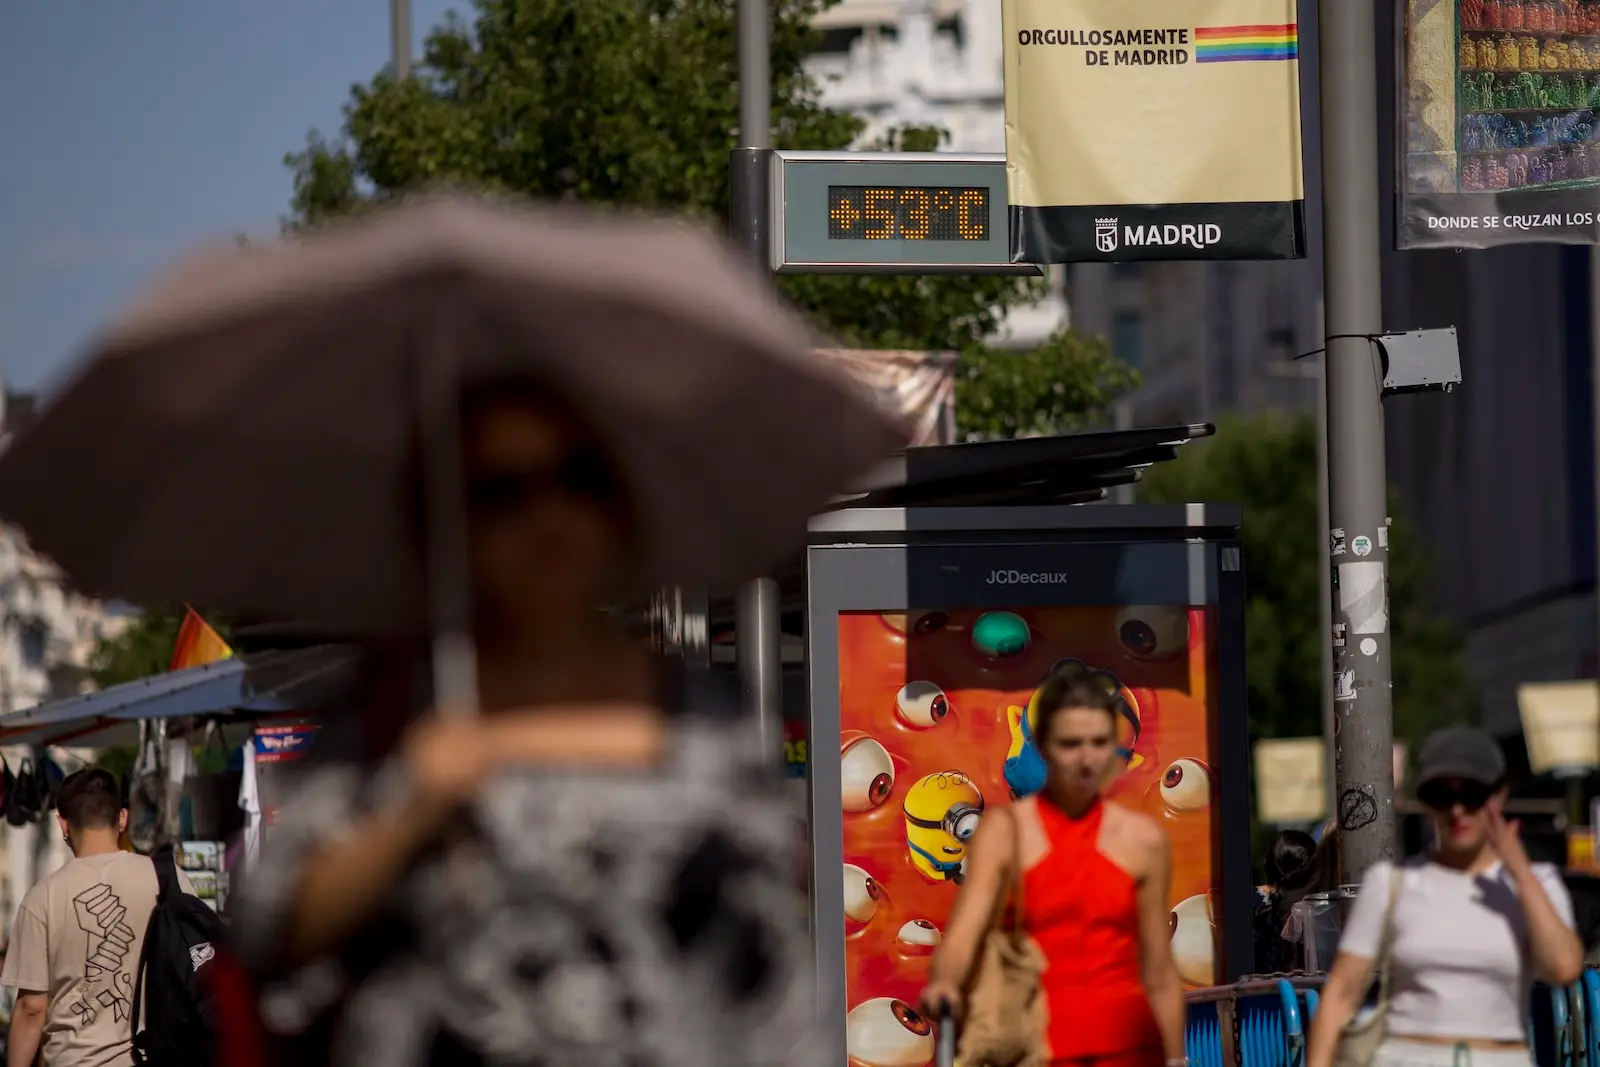
people under umbrellas walk through a seemingly busy area passing a busstop to their left with a thermometer screen that reads +53 degrees C

A thermometer attached to a bus stop in the city center of Madrid reads 53 degrees Celsius, or 127 degrees Fahrenheit. Luis Soto/SOPA Images via Getty Images

Hotter air also makes the atmosphere spongier and capable of holding more water. For every 1 degree Celsius of warming, the atmosphere can hold about 7 percent more moisture. It also holds onto the water for longer. That means more time between rainfalls, and heavier, more dangerous deluges when rain does fall.

Scientists have linked climate change to heavy rainfall events such as the one that flooded Central Texas last summer. In recent days, Super Typhoon Bavi bore down on the Mariana Islands in the Western Pacific. It’s the second super typhoon with the “fingerprint of climate change” to form in the region in a handful of months.

Ocean warming is also a direct cause of sea level rise thanks to a phenomenon known as thermal expansion. As the seas warm, they expand and push further up coastlines, setting the stage for storms like Bavi to cause greater damage.

And recently, a recurring pattern of warm water known as El Niño began cycling through the Pacific, adding even more extreme weather to the equation. That’s because El Niño churns up some of the heat that the ocean absorbs, bringing it toward the surface where it interacts with the atmosphere and reshapes weather around the world. This year’s emerging event, considered a “super El Niño,” has a 81 percent chance of becoming one of the strongest in history, according to a recent forecast by the National Oceanic and Atmospheric Administration.

That means global average temperatures are likely to remain elevated well into early next year, said Matthew England, a professor of physical oceanography and climate science at the University of New South Wales in Australia. “The first year of an El Nino cycle tends to be on the warm side, but the records are generally broken in the second year,” he said.

Every El Niño is different, but each one comes with predictable effects that can help forecasters figure out what to expect, said Alex Sen Gupta, a professor at the Climate Change Research Center, also at the University of New South Wales.

In general, El Niño years are associated with heavier rainfall in places like California and South America and drier conditions across Australia and Southeast Asia. And although El Niño tends to suppress hurricanes near the United States, other regions tend to see stronger cyclones with more rainfall.

There isn’t evidence yet that climate change is making El Niños or La Niñas (the inverse pattern of cool water that forms in intervening years) stronger. But a hotter planet means more intense effects from both of them, Sen Gupta said. And while scientists need more years of data to say for sure, some have hypothesized that the swings between strong El Niño and La Niña years are becoming more frequent.

This story was originally published by Grist with the headline The oceans are full of heat, and it’s coming ashore on Jul 10, 2026.


From Grist via This RSS Feed.

3


cross-posted from: https://scribe.disroot.org/post/10061181

  • Estonia, Luxembourg and UK are the top three in biennial Yale University index in tackling pollution and other issues
  • US, China are falling further behind, the researchers say

...

The biennial Yale University index again ranks Estonia as the best-performing of 177 assessed countries, after strong recent efforts to reduce its greenhouse gas emissions and protect its ecosystems. Luxembourg is second, and the UK is third, having moved up from fifth place in the 2024 index.

European countries dominate the top 20, with only Japan, in 16th, not situated in the continent. Australia is in 25th place, two places ahead of the US. Laos is the last-ranked nation, with the bottom three rounded out by India and Bangladesh.

...

Despite this worsening situation, several countries, most notably the US under Donald Trump, have recently scaled back efforts to combat the climate crisis. The Yale index uses data up to 2024, capturing the last part of Joe Biden’s presidency rather than Trump’s, but still finds that even then the US’s emissions were falling far too slowly to reach net zero by 2050, as the science demands must be done to avoid disastrous climate breakdown.

China, now the world’s largest carbon emitter ahead of the US, has made huge progress in developing its clean energy sector, the Yale report finds, but still derives 56% of its electricity from coal, the dirtiest of fossil fuels, and performs relatively poorly on its marine conservation and biodiversity stewardship, the scorecard found.

...

“Europe has really stepped out in front and is continuing to pursue climate change with not the full vigor it might have a few years back when the political circumstances were different, but they’re getting the payback for decades now of work on this issue at the cutting edge,” said Esty.

“The laggards in the US and China both are still lagging, seem to be falling further behind and are holding back the global community’s efforts to achieve the targets that have been agreed upon.”

China has climbed the table somewhat to 129th position, however, after previously being ranked near last due to the dangerous air pollution suffered by many of its major cities. It has since removed many of the coal-fired power plants near cities that caused such problems. The Yale index also marks India down for its tree cover loss, pesticide pollution risks and ocean conservation from the last index. “India’s performance is shockingly bad for a country that aspires to be a leader in global terms on the economy,” Esty said.

...

Archived

4
Pangaea (upload.wikimedia.org)


Pangaea is the name given to a super-continent which existed some 200 million years ago at the time of the earliest dinosaurs. Pangaea consisted of all the present-day continents drawn into one landmass.

Author: Kieff (2009)

CC BY-SA 3.0

5
The Atmosphere (2003) (upload.wikimedia.org)


cross-posted from: https://lemmy.world/post/49258900

Composition diagram showing the evolution/cycles of various elements in Earth's atmosphere. Original subscript: Schematic of chemical and transport processes related to atmospheric composition. These processes link the atmosphere with other components of the Earth system, including the oceans, land, and terrestrial and marine plants and animals.

Author: Phillipe Rekacewicz

6
The Nitrogen Cycle (upload.wikimedia.org)


cross-posted from: https://lemmy.world/post/49258833

The diagram shows the storage and exchange of nitrogen between the atmosphere and the biosphere, highlighting the role of bacteria. The atmosphere is about 78% nitrogen.

Author: Environmental Protection Agency employee

7


Author: NOAA National Severe Storms Laboratory

8
The Greenhouse Effect (upload.wikimedia.org)


cross-posted from: https://lemmy.world/post/49258732

This figure is a simplified, schematic representation of the flows of energy between space, the atmosphere, and the Earth's surface, and shows how these flows combine to trap heat near the surface and create the greenhouse effect. Energy exchanges are expressed in watts per square meter (W/m2).

Data is from 2007 CERES satellite instruments.

Year 2021 update (not in diagram): Net absorbed energy (shown as 0.6) rose to above 1.0 W/m2 based on independent CERES and ocean heat content measurements.(see fig.1 in Loeb et al.(2021), Geoph. Res. Let 48 (13), doi:10.1029/2021GL093047)

The sun is responsible for virtually all energy that reaches the Earth's surface. Direct overhead sunlight at the top of the atmosphere provides 1366 W/m2; however, geometric effects and reflective surfaces limit the light which is absorbed at the typical location to an annual average of ~235 W/m2. If this were the total heat received at the surface, then, neglecting changes in albedo, the Earth's surface would be expected to have an average temperature of -18 °C (Lashof 1989). Of the surface heat captured by the atmosphere, more than 75% can be attributed to the action of greenhouse gases that absorb thermal radiation emitted by the Earth's surface. The atmosphere in turn transfers the energy it receives both into space (38%) and back to the Earth's surface (62%), where the amount transferred in each direction depends on the thermal and density structure of the atmosphere. This process by which energy is recycled in the atmosphere to warm the Earth's surface is known as the greenhouse effect and is an essential piece of Earth's climate. Under stable conditions, the total amount of energy entering the system from solar radiation will exactly balance the amount being radiated into space, thus allowing the Earth to maintain a constant average temperature over time.

However, recent measurements indicate that the Earth is presently absorbing 0.85 ± 0.15 W/m2 more than it emits into space (Hansen et al. 2005). An overwhelming majority of climate scientists believe that this asymmetry in the flow of energy has been significantly increased by human emissions of greenhouse gases

Author: Robert A. Rohde

GFDL 1.2

9
The Carbon Cycle (2008) (upload.wikimedia.org)


cross-posted from: https://lemmy.world/post/49258503

This carbon cycle diagram shows the storage and annual exchange of carbon between the atmosphere, hydrosphere (oceans) and geosphere (land) in gigatons - or billions of tons - of Carbon (GtC). Burning fossil fuels by people adds about 5.5 GtC of carbon per year into the atmosphere.

Author: Kevin Saff

10
The Water Cycle (upload.wikimedia.org)


cross-posted from: https://lemmy.world/post/49249815

The diagram shows the storage and exchange of water between the atmosphere, the geosphere (land) and the oceans. Transformations of water between ice, liquid and vapour are shown, as is the terminology for these transformations.

Author: John M. Even / USGS

11


The image shows relations between Axial tilt (also called Obliquity), rotation axis, plane of orbit, celestial equator and ecliptic. Earth is shown as viewed from the Sun, the orbit direction is counter-clockwise (to the left).

Author: Dennis Nilsson

CC BY 3.0

12
13
 
 
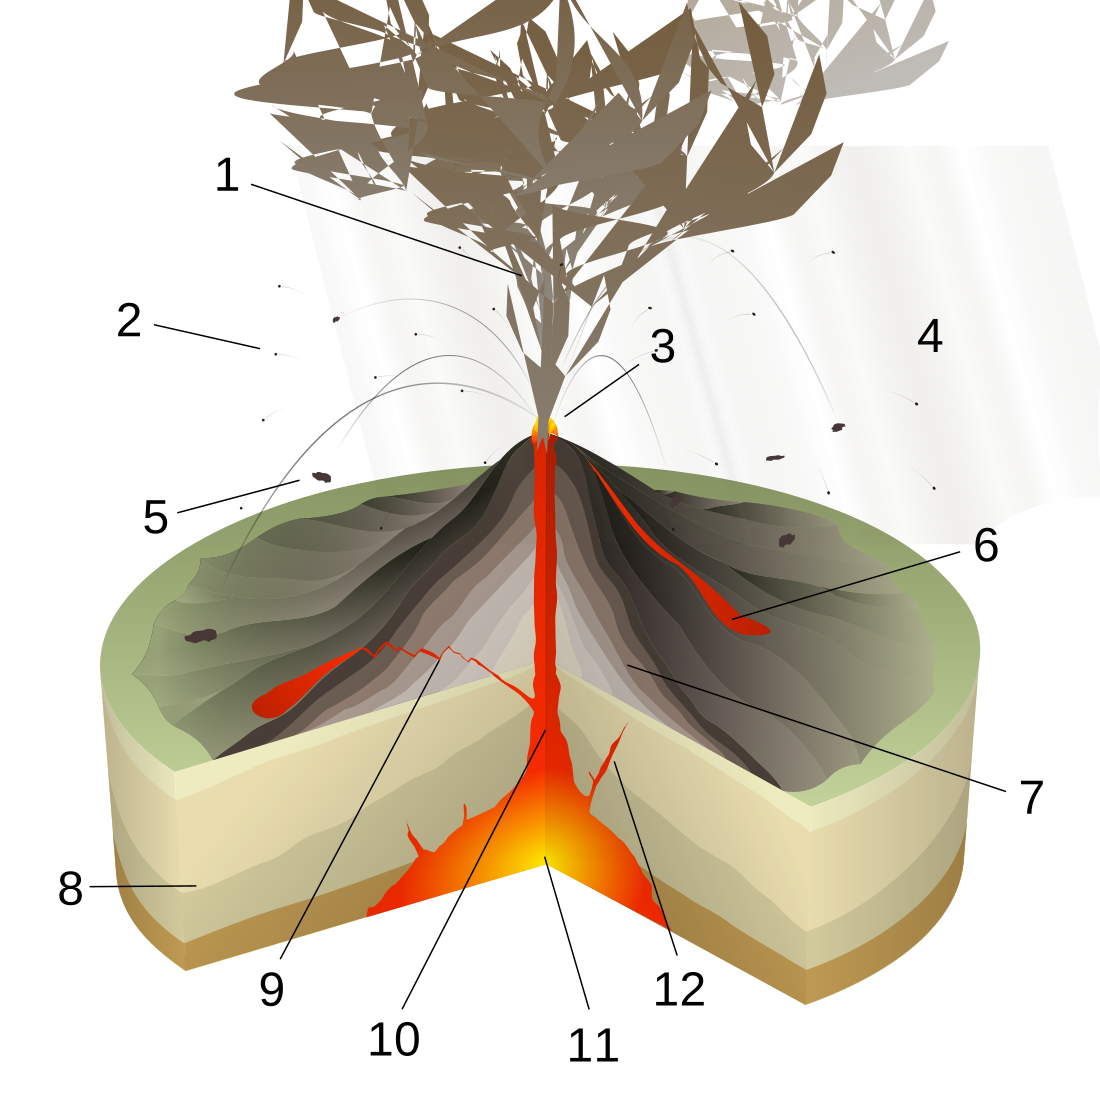
  1. Ash plume
  2. Lapilli
  3. Lava fountain
  4. Volcanic ash rain
  5. Volcanic bomb
  6. Lava flow
  7. Layers of lava and ash
  8. Stratum
  9. Sill
  10. Magma conduit
  11. Magma chamber
  12. Dike

Author: Sémhur

CC BY-SA 4.0

14
15
16
17
 
 
18
19


The structure of the Earth is chemically divided into layers. The Earth has an outer silicate solid crust, a highly viscous mantle, a liquid outer core that is much less viscous than the mantle, and a solid inner core.

Author: Washiucho

20
21
22


Volcano eruption next to Litli-Hrútur in Iceland in 2023 recorded from up close with a drone. Such a video was only made possible by the use of new technologies, since it is otherwise impossible to safely observe an erupting volcano at such close range. As the lava gets ejected from the warmest place, its temperature quickly decreases and the lava changes its color from yellow to orange, to red, to brown, and finally to black. Video recorded by Giles Laurent

Author: Giles Laurent

CC BY-SA 4.0

23


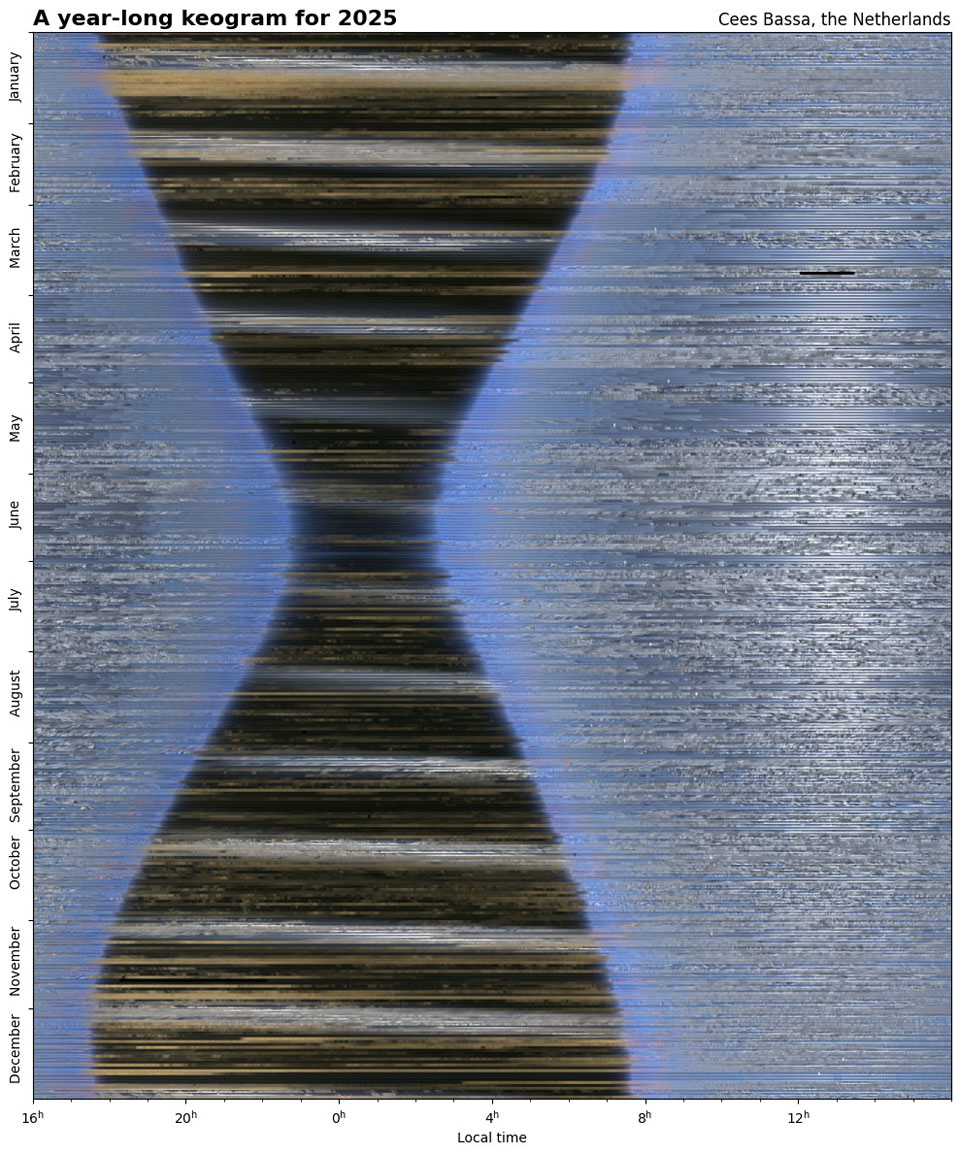
What if you could see the entire sky -- all at once -- for an entire year? That, very nearly, is what is pictured here. Every 15 seconds during 2025, an all-sky camera took an image of the sky over the Netherlands. Central columns from these images were then aligned and combined to create the featured keogram, with January at the top, December at the bottom, and the middle of the night running vertically just left of center. What do we see? Most obviously, the daytime sky is mostly blue, while the nighttime sky is mostly black. The twelve light bands crossing the night sky are caused by the glow of the Moon. The thinnest part of the black hourglass shape occurs during the summer solstice, like today, when days are the longest, while the thickest part occurs at the winter solstice. Equinoxes can also be located in the keogram, for example the northern-spring equinox from one year ago is about three-quarters of the way up.

Source

24
25
view more: next ›