CloudNativePG with barman backups makes it quite manageable.
I personally have a K3S cluster I host at home and an auto-scaled cluster in Hetzner. I see different use cases and am happy to have both.
One thing to mention is that you can also run your own tunnel with something like pangolin on a VPS (CX23 is plenty). Thus, you could have a cheaper could bill if you wanted a hybrid setup.
Also, I highly recommend moving your node to a data center closer to home.
I’m running Immich on an old ThinkCentre with the default feature set. Currently looking at:
- Server: 1.4 GB
- ML: 288 MB
- Valkey: 8 MB
- Postgres: ~500 MB
There is a bit more overhead for the control plane and cloud-native PG operator/backup pods but my instance fits comfortably inside a ~4GB allocation.
I guess if the serious thing you’re doing is a CRUD app?
Tell that to YouTube and Spotify. Or astronauts on the ISS. Or anyone doing science really…
Machine learning and CV? Geospatial? Math in general?
God forbid they had Christmas holidays 🙄
It’s probably just that I got used to it with XFCE at some point. My main two concerns:
- I love having the path in the navbar (and not have to Ctrl-L)
- I don’t like having devices tucked behind “Other Locations” rather than in the sidebar
Otherwise, I find Nautilus much more aesthetically pleasing.
I’m a gnome guy but always swap to Thunar on a fresh install.
Server is meant for all users of a single server.
So, you could buy 1-3 individual licenses or the server license for 4+ users.
[deleted]
Really looking forward to running type checks with pre-commit. Mypy is just too slow with most code bases.
Basic HTML hosted at cv.dallen.co
I have a pipeline that creates a PDF version with weasyprint: https://github.com/damienallen/cv
Repo: https://github.com/damienallen/urban-heat
cross-posted from: https://programming.dev/post/14939898
I wanted to share a small project I've been working on. The goal was to make the data from NASA's Landsat Thermal Infrared Sensor more accessible to the general public.
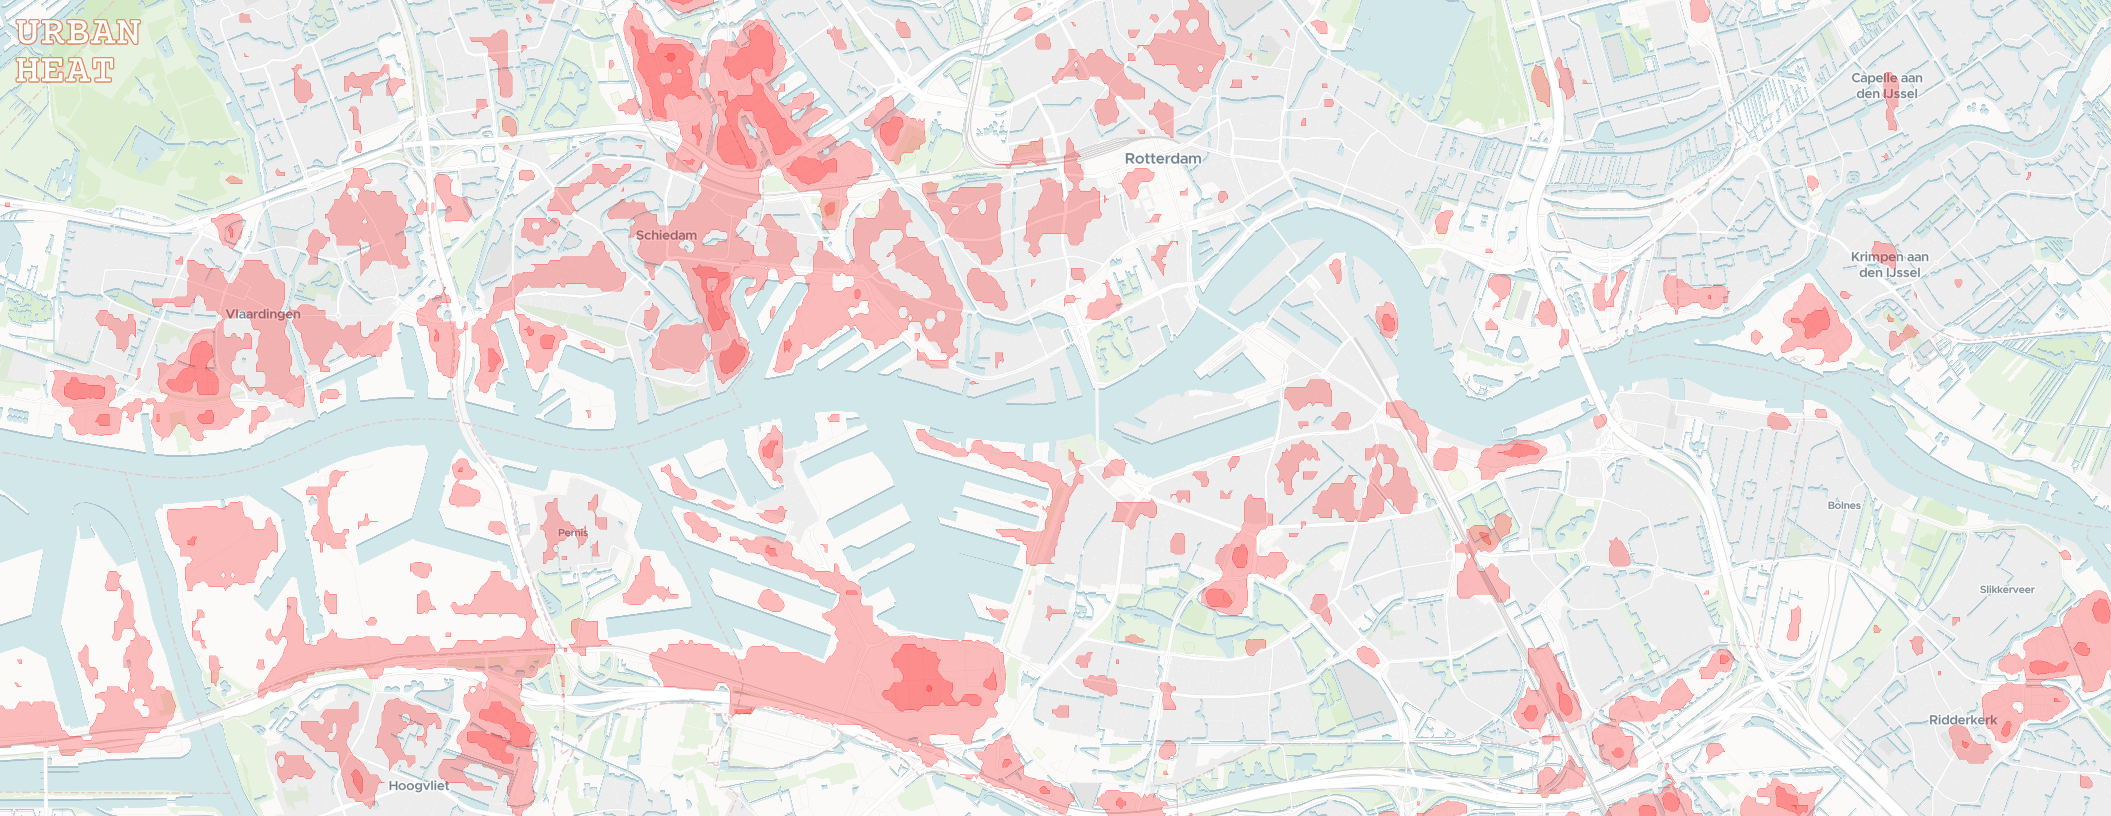
I worked with the raw temperature band data to general annual maximum surface temperature raster images for large urban areas covered by the Eurostat GISCO Urban Audit. In the browser, these images are transformed into easier to interpret isotherm contours with some adjustable settings.
I don't have a specific target audience in mind. The map could help identify areas of refuge for the warmer months, or overheated neighborhoods to avoid as we march towards a toasty future.
Feedback is welcome :)
repo: https://github.com/damienallen/urban-heat
cross-posted from: https://programming.dev/post/14939898
I wanted to share a small project I've been working on. The goal was to make the data from NASA's Landsat Thermal Infrared Sensor more accessible to the general public.
I worked with the raw temperature band data to general annual maximum surface temperature raster images for large urban areas covered by the Eurostat GISCO Urban Audit. In the browser, these images are transformed into easier to interpret isotherm contours with some adjustable settings.
I don't have a specific target audience in mind. The map could help identify areas of refuge for the warmer months, or overheated neighborhoods to avoid as we march towards a toasty future.
Feedback is welcome :)
view more:
next ›