[–] 4 points 2 days ago

Zumindest bei mir ist das so

Je ausgeglichener ich bin desto mehr achte ich auch auf meine ernährung.

Wenn ich gestresst bin will ich einfach nicht über solche dinge nachdenken und ess mehr scheiß inklusive Fleisch

Ich esse aber generell auch nur noch selten Fleisch von dem weiß ich nicht wie gut sich das übertragen lässt

  • source
  • parent
  • context
  • [–] 9 points 1 week ago (3 children)

    My brother im christ

    Are you ok?

    You do realize who you are talking about. Love him or hate him but Linus Torvalds is THE Linux guy

    I hate that these discussion often seem to happen in a vaccuum regarding the person.

    This man has spent over 30 years writing/maintaining the Kernel. He most certainly knows more than yoi about the kernel the maintainablility and maybe most importantly: The community

    Take it down a notch will ya?

  • source
  • parent
  • context
  • submitted 1 year ago* (last edited 1 year ago) by to c/labplot@lemmy.kde.social
     

    Update: Fixed in 2.11.1-4

    Was a packaging issue. Solved within one hour after creating a bugreport. Many thanks to the incredible team!

    I run Arch (btw) with KDE plasma using the wayland session.

    Today I ran into labplot2: error while loading shared libraries: liborcus-0.18.so.0: cannot open shared object file: No such file or directory

    I got the same error for libixion-0.18.

    For both libraries I had version 20 something installed.

    Is this currently broken? Did anyone else run into the same problem? Libreoffice which also uses liborcus has no problems so I assume it was a Labplot issue. Will file a bugreport as soon as I have a KDE account :D

    Workaround: I got it to work by creating symlinks form version 18 -> 20

    submitted 2 years ago* (last edited 2 years ago) by to c/labplot@lemmy.kde.social
     

    Hi all,

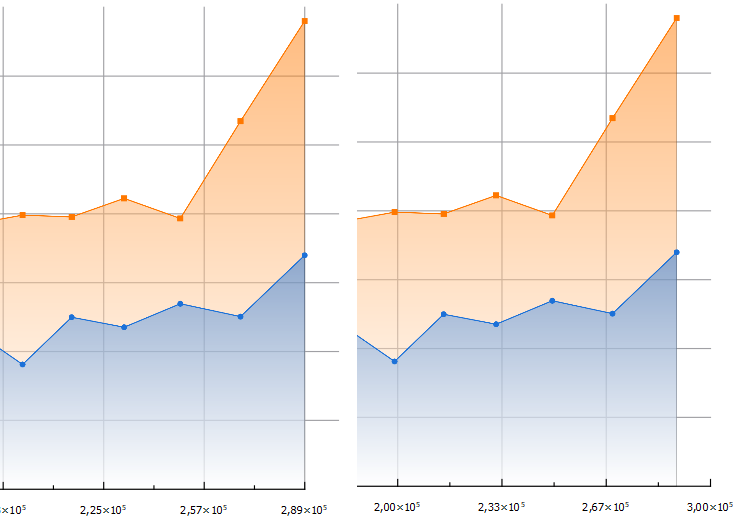
    I just started using labplot. Mainly for visualization so far. I am currently plotting stuff in a line plot. For some reason I cannot figure out how to properly align my x-axis. If I reduce the data range my gridlines overextend. If I increase the x-axis range the axis just extends over my data.

    Anyone know how to make this fit.

    Sorry for the basic question but I have been banging my head against this for 2 days now and just can't figure it out.

    If you have some good material beside the videos and documentation I am also happy to just take a link.

    Thanks :)

    edit: I use LabPlot 2.10.0 on Windows

    view more: next ›