▲ 65 ▼ How much progress have we made on climate change? (youtu.be) submitted 1 year ago by psx_crab@lemmy.zip to c/videos@lemmy.world 17 comments fedilink hide all child comments Really appreciate this channel's effort on trying to dispel doomism.
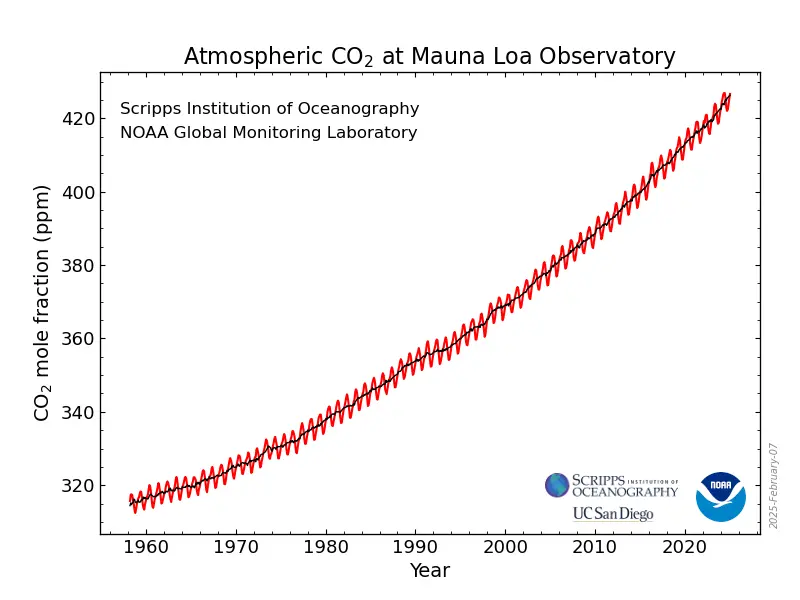
[–] baltakatei@sopuli.xyz 9 points 1 year ago* (1 child) checks atmospheric carbon dioxide No progress. permalink fedilink source hideshow 2 child comments replies: [–] psx_crab@lemmy.zip [S] 2 points 1 year ago (2 children) This is disingenuous. To lower atmospheric co2 we need to actively absorb co2 out from the atmosphere while the output of co2 is lower than the absorption. So to even see a progress on this chart we need to first achieve net zero. permalink fedilink source parent hideshow 4 child comments replies: [+] PiJiNWiNg@sh.itjust.works 7 points 1 year ago* (last edited 1 year ago) [deleted] permalink fedilink source parent [–] Cort@lemmy.world 4 points 1 year ago (1 child) No, we would see an infection point on this chat if we were to make progress, even if we're not at net zero. The chart would at least be increasing at a decreasing rate, as opposed to the current trajectory increasing at a steady or even increasing rate. permalink fedilink source parent hideshow 2 child comments replies: [–] jol@discuss.tchncs.de 0 points 1 year ago (1 child) Actually, since 2020 the curve looks linear rather than exponential, which does match what he says on the video that we might have stopped increasing emissions year over year. Obviously this is not enough, but it is progress. permalink fedilink source parent hideshow 2 child comments replies: [–] Wade@lemmy.world 1 point 1 year ago Probably just due to covid lockdowns. Emissions have been steadily increasing since https://www.statista.com/statistics/276629/global-co2-emissions/ permalink fedilink source parent
[–] psx_crab@lemmy.zip [S] 2 points 1 year ago (2 children) This is disingenuous. To lower atmospheric co2 we need to actively absorb co2 out from the atmosphere while the output of co2 is lower than the absorption. So to even see a progress on this chart we need to first achieve net zero. permalink fedilink source parent hideshow 4 child comments replies: [+] PiJiNWiNg@sh.itjust.works 7 points 1 year ago* (last edited 1 year ago) [deleted] permalink fedilink source parent [–] Cort@lemmy.world 4 points 1 year ago (1 child) No, we would see an infection point on this chat if we were to make progress, even if we're not at net zero. The chart would at least be increasing at a decreasing rate, as opposed to the current trajectory increasing at a steady or even increasing rate. permalink fedilink source parent hideshow 2 child comments replies: [–] jol@discuss.tchncs.de 0 points 1 year ago (1 child) Actually, since 2020 the curve looks linear rather than exponential, which does match what he says on the video that we might have stopped increasing emissions year over year. Obviously this is not enough, but it is progress. permalink fedilink source parent hideshow 2 child comments replies: [–] Wade@lemmy.world 1 point 1 year ago Probably just due to covid lockdowns. Emissions have been steadily increasing since https://www.statista.com/statistics/276629/global-co2-emissions/ permalink fedilink source parent
[+] PiJiNWiNg@sh.itjust.works 7 points 1 year ago* (last edited 1 year ago) [deleted] permalink fedilink source parent
[–] Cort@lemmy.world 4 points 1 year ago (1 child) No, we would see an infection point on this chat if we were to make progress, even if we're not at net zero. The chart would at least be increasing at a decreasing rate, as opposed to the current trajectory increasing at a steady or even increasing rate. permalink fedilink source parent hideshow 2 child comments replies: [–] jol@discuss.tchncs.de 0 points 1 year ago (1 child) Actually, since 2020 the curve looks linear rather than exponential, which does match what he says on the video that we might have stopped increasing emissions year over year. Obviously this is not enough, but it is progress. permalink fedilink source parent hideshow 2 child comments replies: [–] Wade@lemmy.world 1 point 1 year ago Probably just due to covid lockdowns. Emissions have been steadily increasing since https://www.statista.com/statistics/276629/global-co2-emissions/ permalink fedilink source parent
[–] jol@discuss.tchncs.de 0 points 1 year ago (1 child) Actually, since 2020 the curve looks linear rather than exponential, which does match what he says on the video that we might have stopped increasing emissions year over year. Obviously this is not enough, but it is progress. permalink fedilink source parent hideshow 2 child comments replies: [–] Wade@lemmy.world 1 point 1 year ago Probably just due to covid lockdowns. Emissions have been steadily increasing since https://www.statista.com/statistics/276629/global-co2-emissions/ permalink fedilink source parent
[–] Wade@lemmy.world 1 point 1 year ago Probably just due to covid lockdowns. Emissions have been steadily increasing since https://www.statista.com/statistics/276629/global-co2-emissions/ permalink fedilink source parent